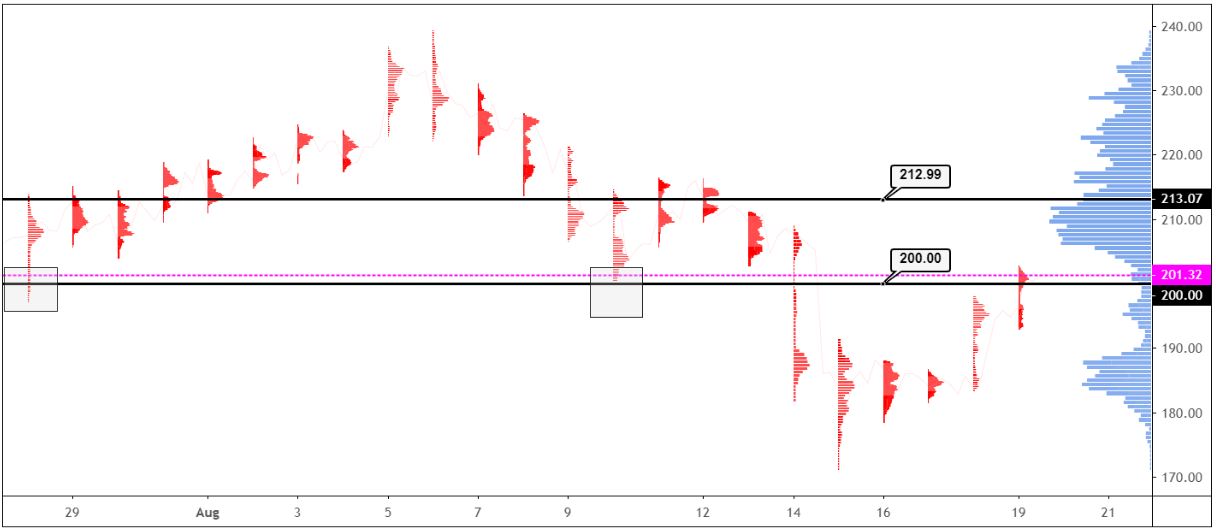
- ETH/USD Market Profile Structure breaks higher above 200.00
- Price could still break back below as the volume on the break has not been massive
- Next consolidation resistance is at 212.99
For those who are not used to volume profile charts, they break down the volume structure of the market on a day by day basis.
The main importance of the chart shows where the greatest volume is traded at what price.
More importantly, they are very good at working out support and resistance areas in charts. Just remember not all the exchanges have heavy volume so use the crosses from the major exchanges.
On the right-hand side of the chart is a composite volume bell curve. This is a summation of all the price at volume data on the chart.
Underneath I have plotted the same data but with a candlestick chart so you can see the difference in the information. The 200.00 level still looks very important but in a different way.
The break of the 200.00 level happened with 7.487 contracts traded although this is higher than average on big breaks in this pair (ETH/USD) we can see anything up to 100,000 on a big break with an average of around 25,000 on the last four important ones.
%20(3)-637018274574051631.png)
