- ETH/USD went up from $265.15 to $269.25 this Wednesday.
- The sentiment is currently bearish in the early hours of Thursday.
ETH/USD daily chart
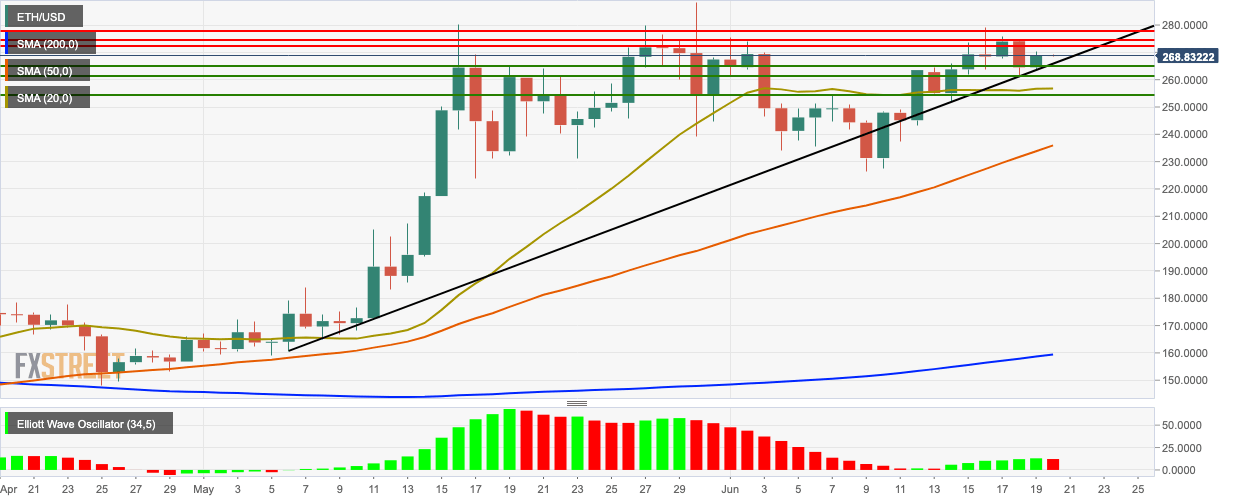
ETH/USD had a bearish opening this Thursday and is currently trading for $268.75. This Wednesday has been pretty bullish as the price went up from $265.15 to $269.25. The market has found support on the upward trending line and is trending above the 200-day simple moving average (SMA 200), SMA 50 and SMA 20 curves. The Elliot oscillator has had a bearish session after six straight bullish sessions. On the upside, the nearest resistance level lies at $272.50 and the closest support level is at $265.25
ETH/USD 4-hour chart
-636965898641063057.png)
The 4-hour ETH/USD market has had a triangle formation from which the market had a bullish breakout. The market has met resistance at the SMA 20 curve, but it is trending above the SMA 200 and SMA 50 curves. The moving average convergence/divergence (MACD) indicator shows that the signal line is about to converge with the MACD line, indicating decreasing bearish momentum.
ETH/USD hourly chart
-636965897821047253.png)
The hourly ETH/USD is trending in a flag formation. The red cloud of the Ichimoku indicator has acted as resistance to the hourly market. The latest session broke past the support provided by the upward trending line, indicating that the bears are in control of the market. The relative strength index (RSI) indicator is trending around 55.
Key Levels
