Home Etheruem Technical Analysis: ETH/USD double top pattern formed, seeing price come under selling pressure from the high of the session
Crypto News

Etheruem Technical Analysis: ETH/USD double top pattern formed, seeing price come under selling pressure from the high of the session

  • Ethereum price was seen up with gains just shy of 1% on the day, which could have been greater if the bulls were able to breakdown some troublesome resistance.
  • ETH/USD has suffered knockback by a known supply area, tracking from $485-480.


ETH/USD 60-minute chart
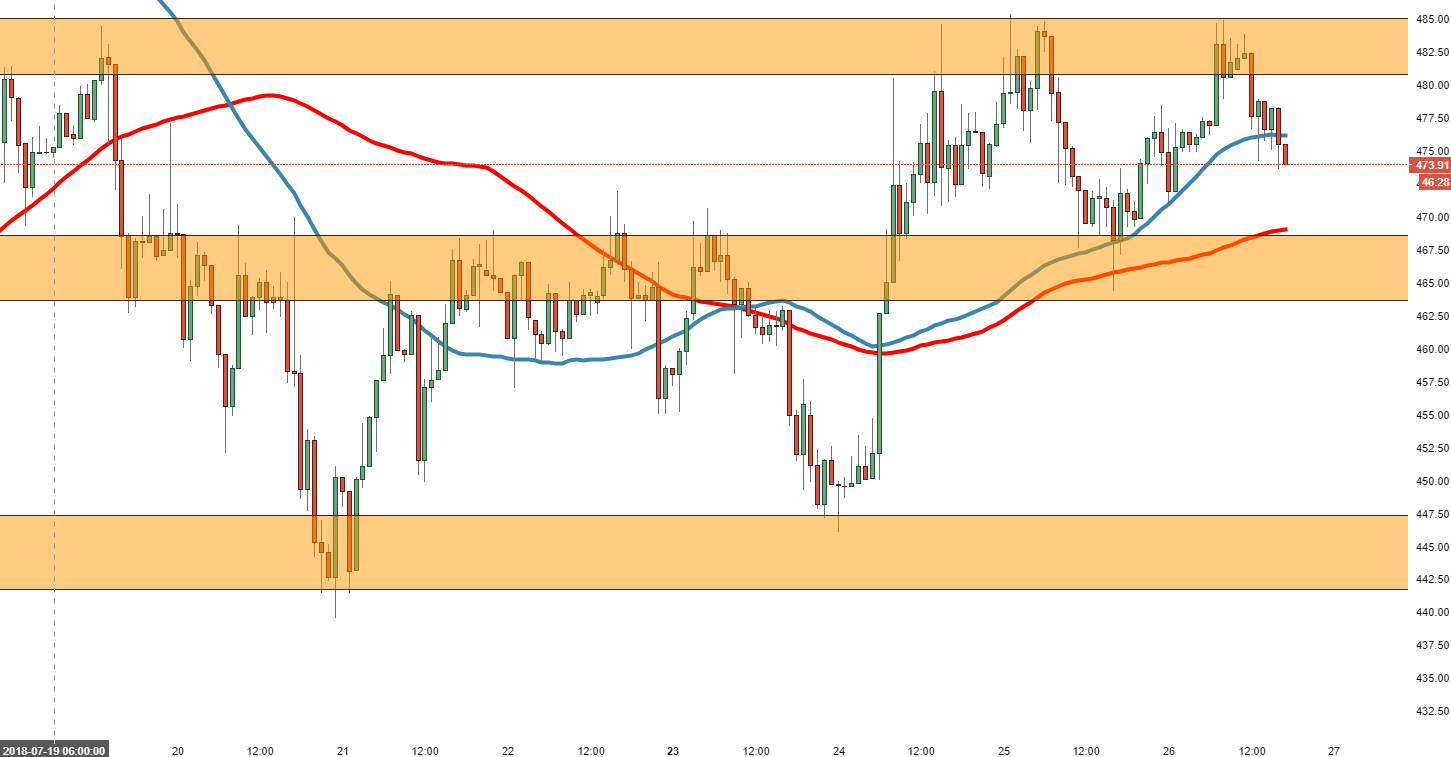
 

Spot rate:                  474.81

Relative change:        +0.70%

High:                          484.87

Low:                            471.88


Trend:                         Neutral


Support 1:                  469.32, 100MA.

Support 2:                  467.50, entrance to demand zone.

Support 3:                  464.33, 25th July low.  

Resistance 1:             476.10, 50MA.

Resistance 2:             481.00, entrance to supply zone.  

Resistance 3:             485.05, potential trip top.


FX Street

FX Street

FXStreet is the leading independent portal dedicated to the Foreign Exchange (Forex) market. It was launched in 2000 and the portal has always been proud of their unyielding commitment to provide objective and unbiased information, to enable their users to take better and more confident decisions.