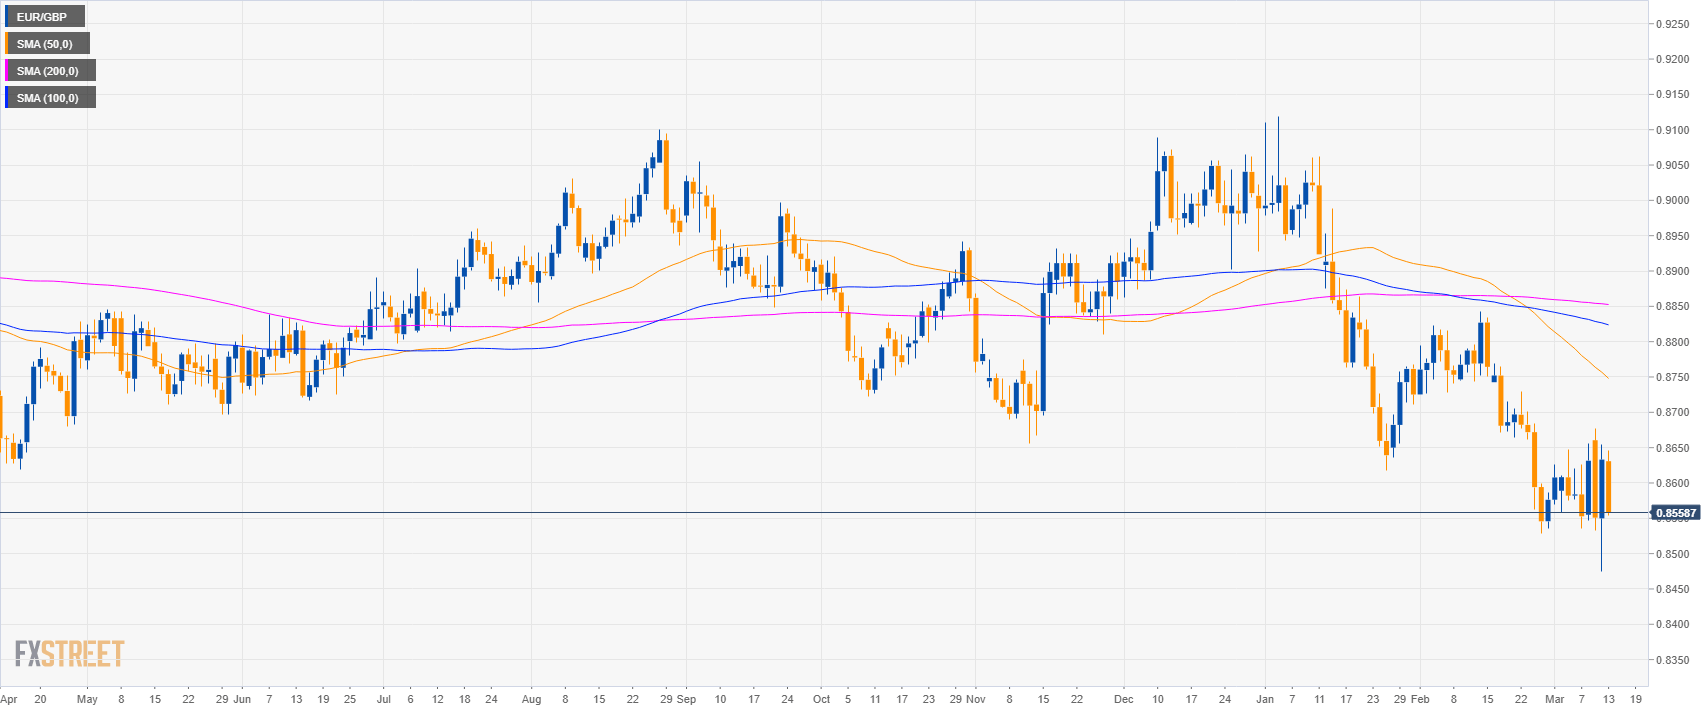
EUR/GBP daily
- EUR/GBP is trading in a sideways trend below its main simple moving averages (SMAs).
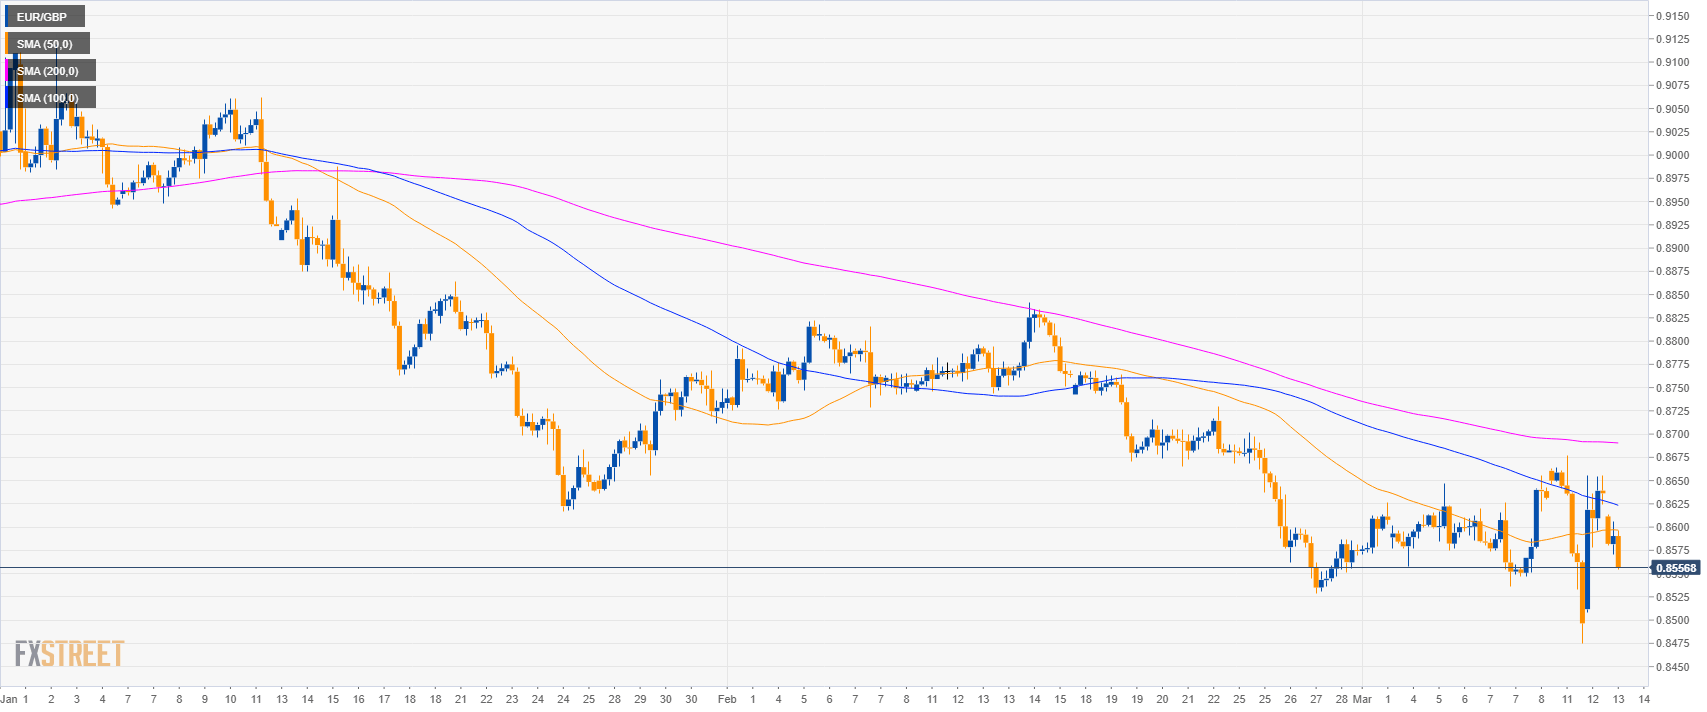
EUR/GBP 4-hour chart
- EUR/GBP is trading below the main SMAs suggesting consolidation in the medium-term.
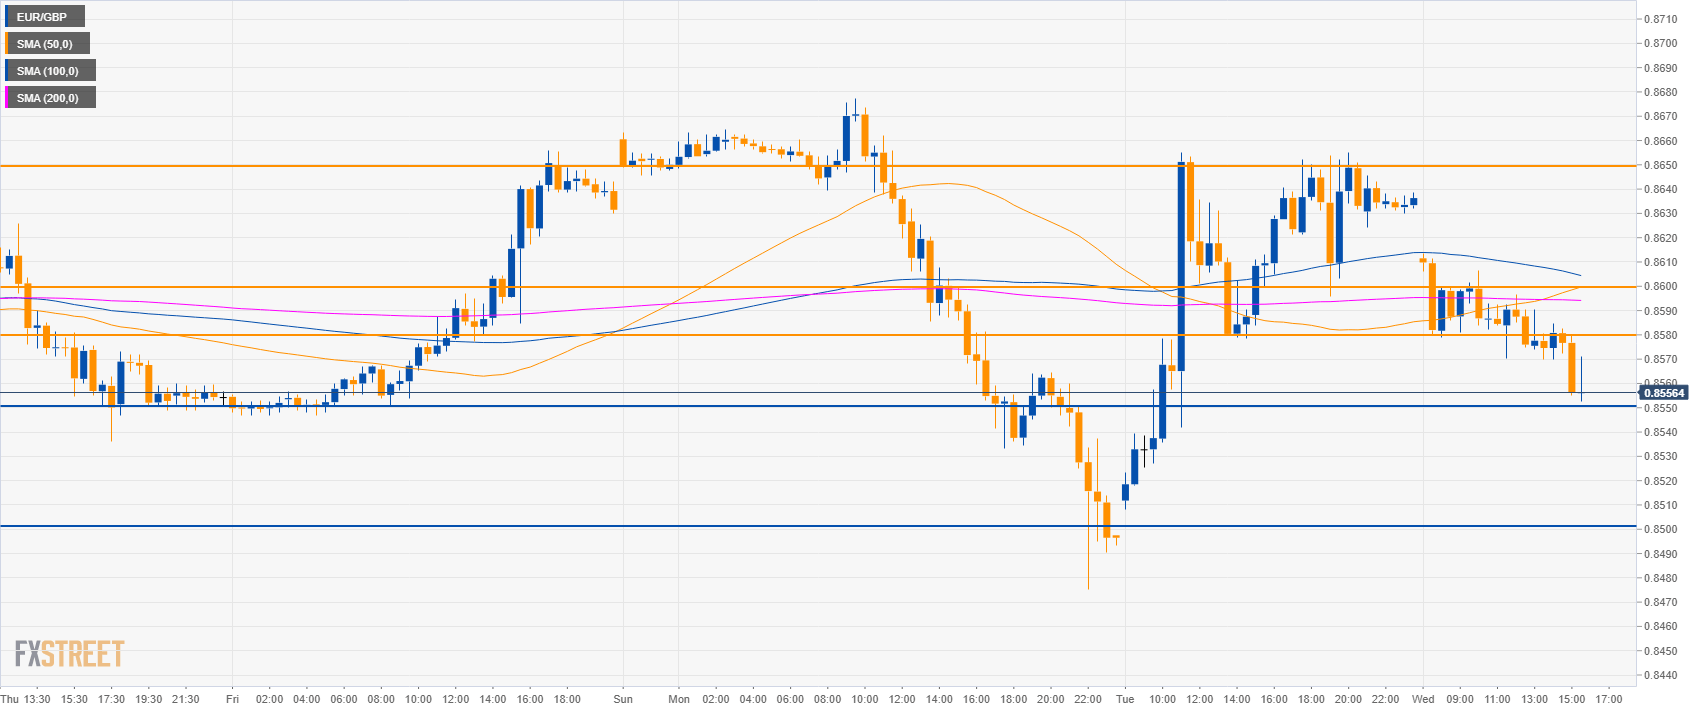
EUR/GBP 30-minute chart
- EUR/GBP is trading below its main SMAs suggesting bearish momentum in the short-term.
- A break below 0.8550 can lead to 0.8500 key support.
- Resistances are seen at 0.8580, 0.8600 and 0.8650 level.
Additional key levels
EUR/GBP
Overview:
Today Last Price: 0.8561
Today Daily change: -72 pips
Today Daily change %: -0.83%
Today Daily Open: 0.8633
Trends:
Daily SMA20: 0.865
Daily SMA50: 0.8757
Daily SMA100: 0.8827
Daily SMA200: 0.8854
Levels:
Previous Daily High: 0.8655
Previous Daily Low: 0.8475
Previous Weekly High: 0.8656
Previous Weekly Low: 0.8536
Previous Monthly High: 0.8842
Previous Monthly Low: 0.8529
Daily Fibonacci 38.2%: 0.8586
Daily Fibonacci 61.8%: 0.8544
Daily Pivot Point S1: 0.8521
Daily Pivot Point S2: 0.8408
Daily Pivot Point S3: 0.8341
Daily Pivot Point R1: 0.87
Daily Pivot Point R2: 0.8767
Daily Pivot Point R3: 0.888
