- EUR/GBP snaps six-day losing streak, bounces off the three-week low.
- Bearish MACD, key resistances stand tall to question the recovery moves.
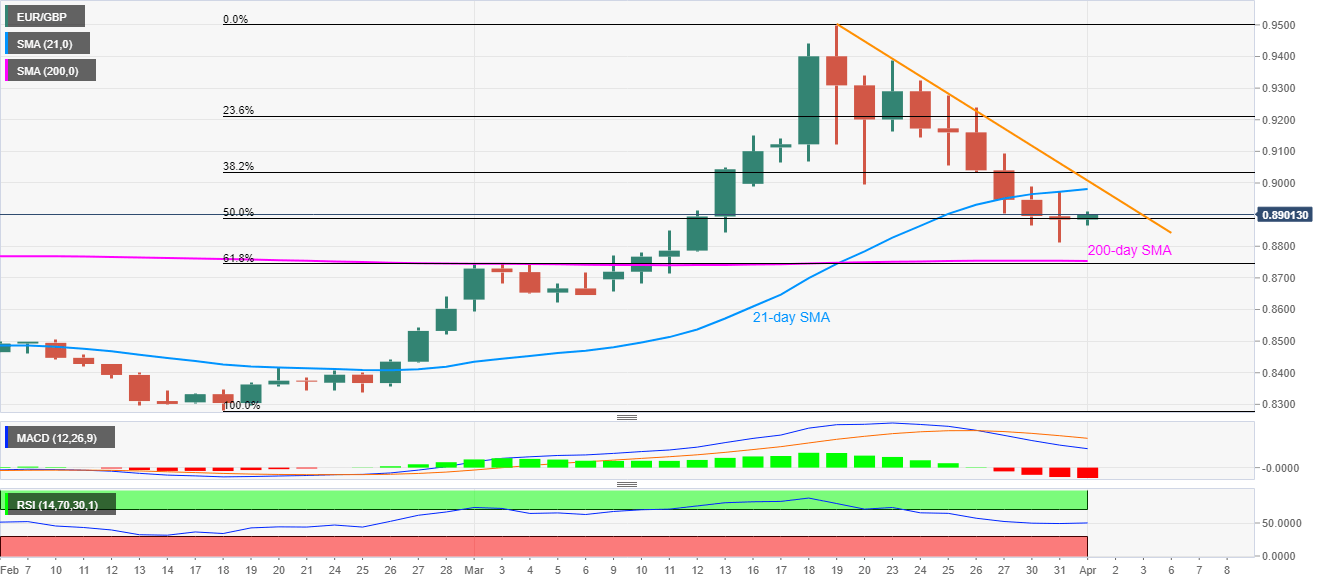
- 61.8% Fibonacci retracement, 200-day SMA limit near-term downside.
Despite marking 0.20% profits to 0.8901, EUR/GBP stays below near-term key resistances while heading into the European open on Wednesday.
Among them, a 21-day SMA level of 0.8980 acts as the closest upside barrier ahead of the falling trend line from March 19, currently at 0.9010.
Other than the aforementioned resistances, bearish MACD signals and an absence of oversold RSI conditions also question the latest recovery.
However, a confluence of 200-day SMA and 61.8% Fibonacci retracement of the pair’s rise between February 18 and March 19, close to 0.8755/45, becomes the strong support on the downside.
Hence, the pair’s latest uptick is less likely to be lasting longer while a bit broader weakness might prevail for a bit more unless testing the key support area.
EUR/GBP daily chart
Trend: Bearish
