- EUR/GBP confirmed a bull Doji reversal higher on Thursday.
- The pair is better bid near 0.87 at press time.
The path of least resistance for EUR/GBP is on the higher, according to technical studies.
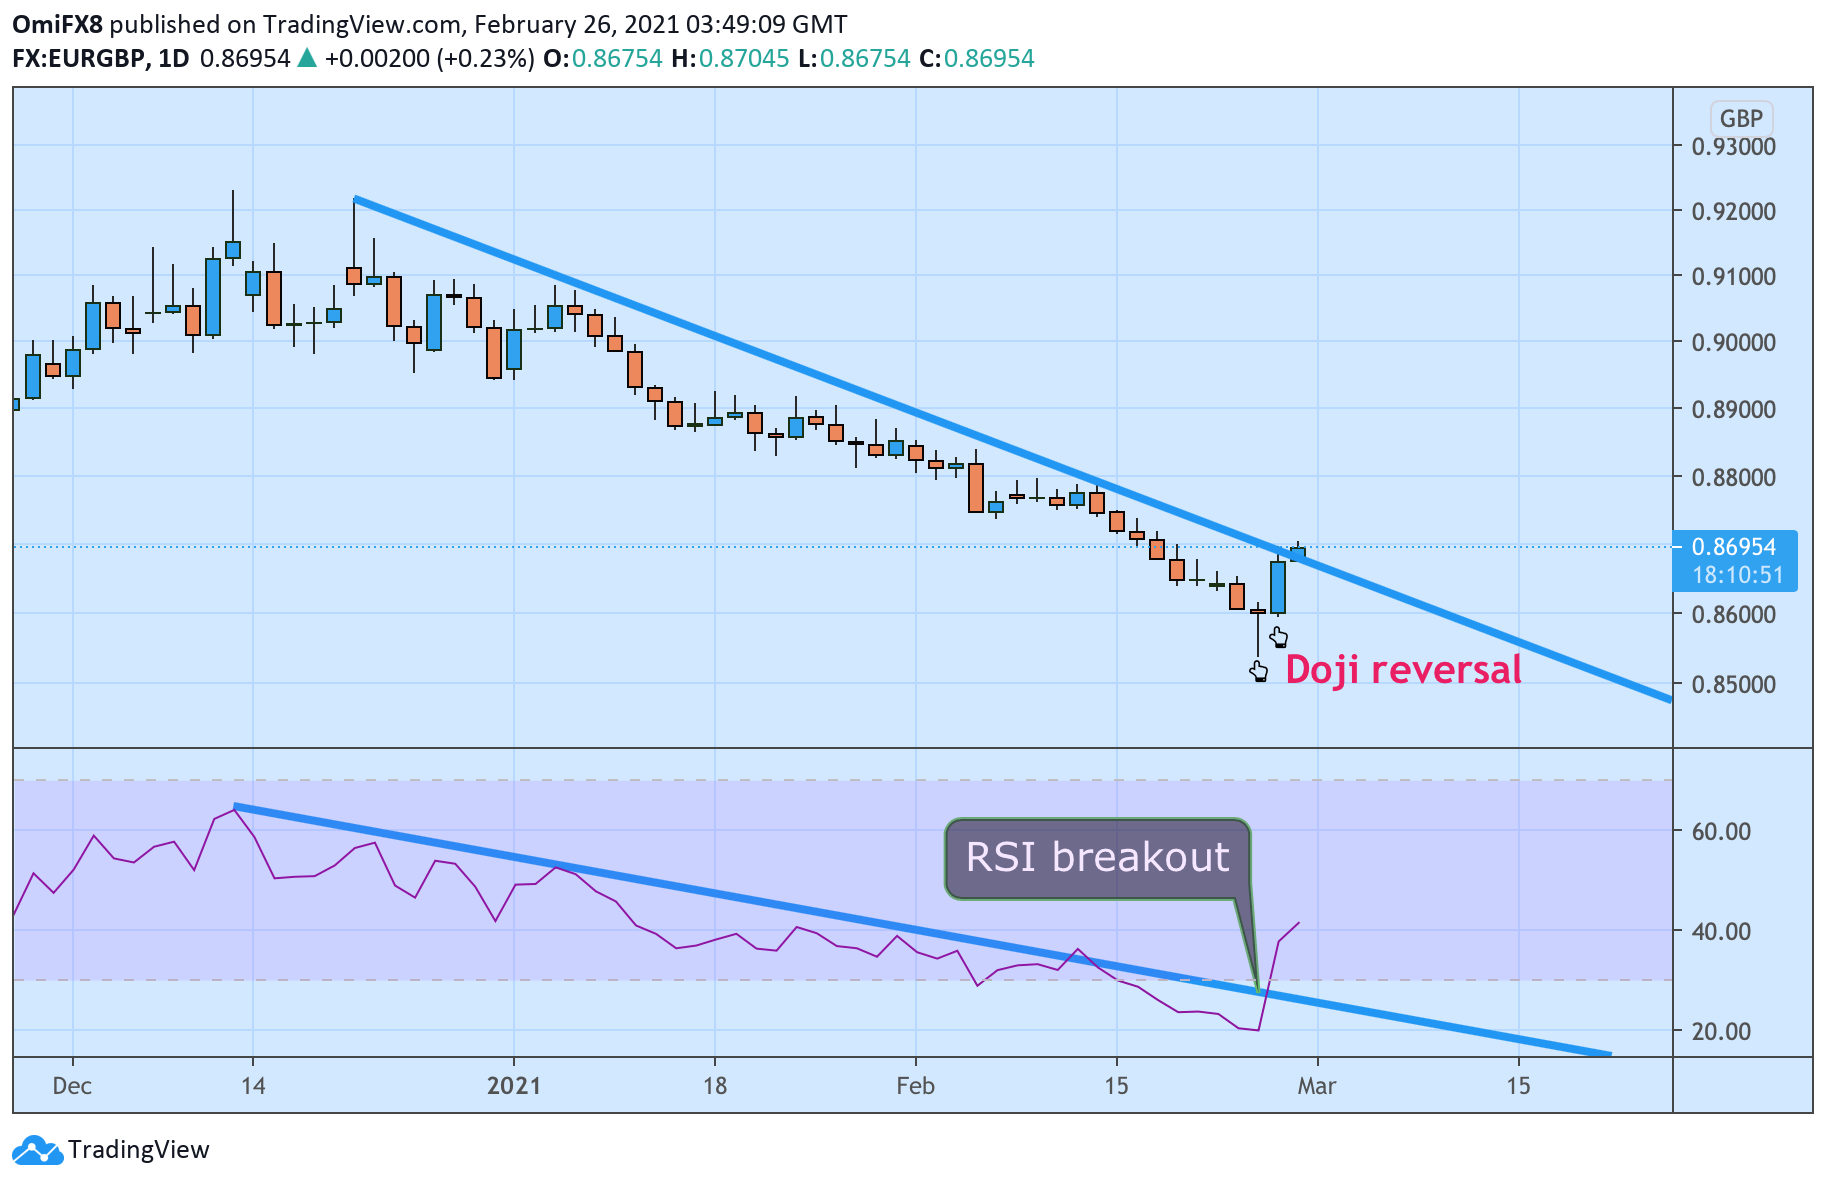
The pair jumped 0.87% on Thursday, marking a positive follow-through to the bear fatigue signaled by Wednesday’s long-tailed Doji candle. In other words, Thursday’s gain confirmed a bullish Doji reversal pattern.
The reversal higher signaled by the candlestick pattern is backed by a breakout on the widely-tracked 14-day Relative Strength Index, a momentum indicator.
The RSI has breached a 2-1/2-month descending trendline, implying an end of the bearish trend from December highs above 0.92.
The pair could challenge resistance at 0.8866 (Sept. 3 low) next week. A close under 0.8539 (Wednesday’s low) would invalidate the bullish bias.
Daily chart
Trend: Bullish
Technical levels
