- EUR/GBP trims intraday losses while bouncing off 0.9014.
- Momentum dwindles inside a multi-day-old symmetrical triangle.
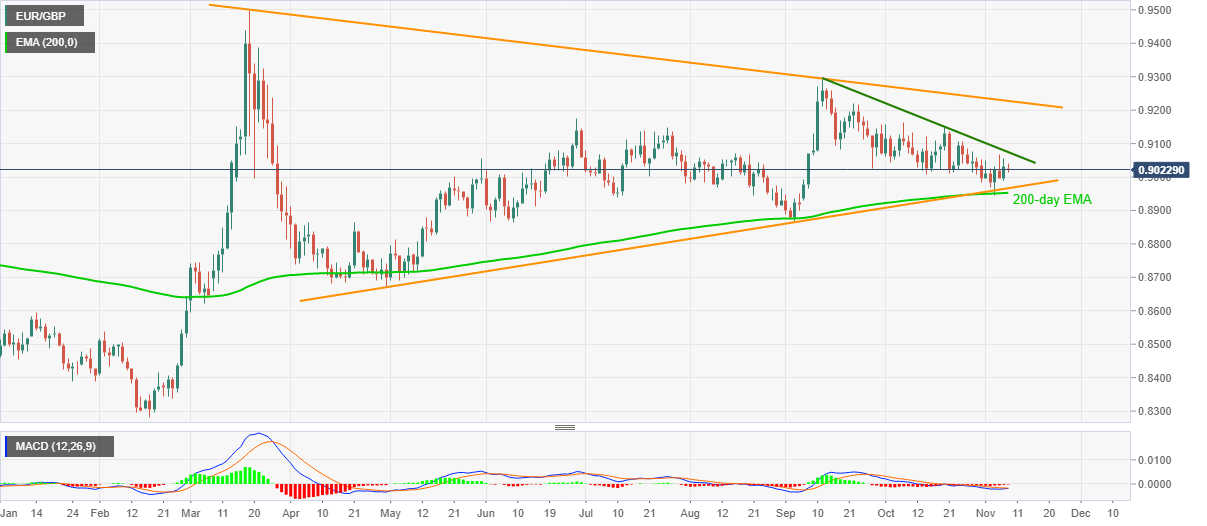
EUR/GBP picks up bids to 0.9022, down 0.10% on a day, during the pre-European trading on Monday. The pair dropped to the lowest in two months the last Wednesday before recovering from 200-day EMA.
However, upside momentum fizzled below a descending trend line from September 11, currently around 0.9075.
Considering the recent pullback moves, amid downbeat MACD signals, the quote is likely to remain depressed. This directs the EUR/GBP sellers towards an ascending support line from April 30, at 0.8966 now, before highlighting the 200-day EMA level of 0.8952 again.
Although the key EMA is likely to keep buyers hopeful, a clear downside below 0.8950 will direct the bears towards the September bottom surrounding 0.8865.
On the upside, a clear break of the stated trend line resistance near 0.9075 can aim for the October 20 peak close to 0.9150 and September 22 peak around 0.9220.
Though, a downward sloping trend line connecting highs marked in March and September, forming part of the broad symmetrical triangle, presently near 0.9230, becomes a key resistance to watch afterward.
EUR/GBP daily chart
Trend: Sideways
