- EUR/GBP remains on the back foot near one-week low.
- 10-day EMA guards immediate upside amid bearish MACD.
- Sellers can eye the bullish formation’s support during further weakness.
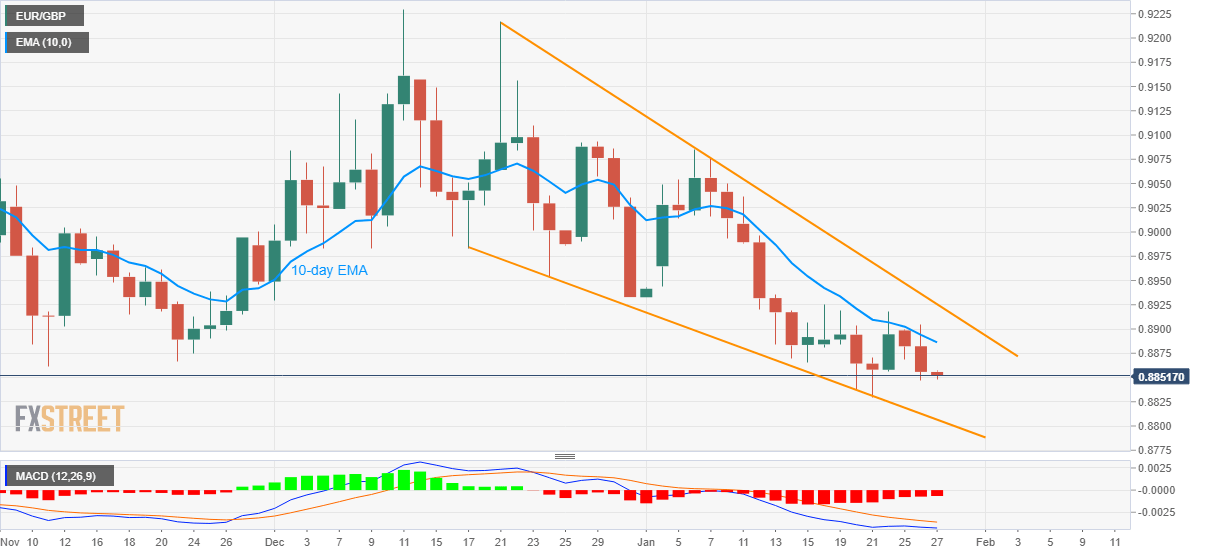
EUR/GBP takes offers near 0.8850, down 0.06% intraday, while heading into the London open on Wednesday. In doing so, the quote drops for the third consecutive day inside a falling wedge bullish chart pattern established since December 17.
Considering the bearish MACD and the pair’s inability to cross 10-day EMA, EUR/GBP sellers are currently targeting the monthly low of 0.8830.
However, any further weakness will be challenged by the lower line of the wedge, at 0.8806 now, followed by the 0.8800 threshold.
Meanwhile, an upside break of 10-day EMA, currently around 0.8885, will direct EUR/GBP buyers to the stated bullish formation’s resistance line near 0.8925.
In a case where the EUR/GBP bulls manage to cross 0.8925, the theoretical run-up towards the December top around 0.9230 should. Though, the 0.9000 psychological magnet and the monthly peak of 0.9085 can act as intermediate halts.
Overall, EUR/GBP is likely to remain depressed but odds of a trend reversal increase to the bullish chart pattern and hesitant weakness.
EUR/GBP daily chart
Trend: Pullback expected
