- EUR/GBP declines from a three-month high.
- Bullish MACD favors confrontation to 61.8% Fibonacci retracement.
- December 2019 top acts as immediate support.
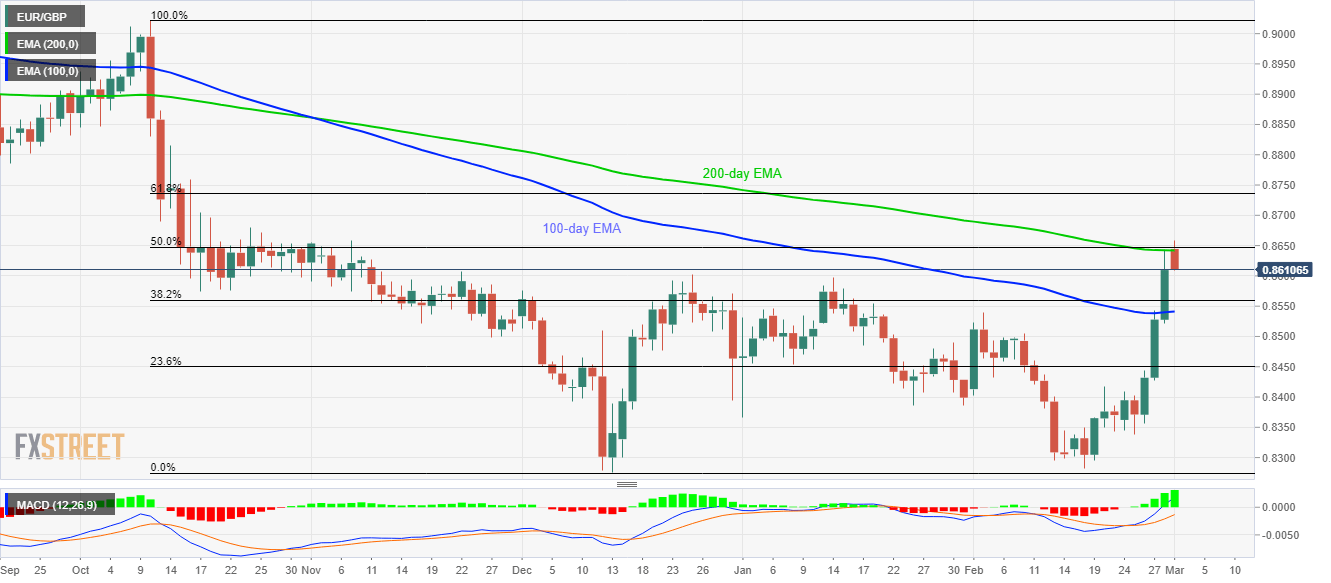
EUR/GBP declines 0.05% to 0.8615 during the pre-Europe session on Monday. In doing so, the pair takes a U-turn from a confluence of 200-day EMA and 50% Fibonacci retracement level of its October-December fall.
That said, December 2019 top surrounding 0.8600 and 38.2% Fibonacci retracement near 0.8560 acts as the immediate supports to watch.
However, buyers should not lose their hopes unless EUR/GBP prices slip below the 100-day EMA level of 0.8540 on a daily closing basis.
Meanwhile, bullish MACD favors the odds of the pair’s further upside towards 61.8% Fibonacci retracement level of 0.8735.
In a case where the quote remains positive past-0.8735, September 2019 low close to 0.8785 will be the key to watch.
EUR/GBP daily chart
Trend: Bullish
