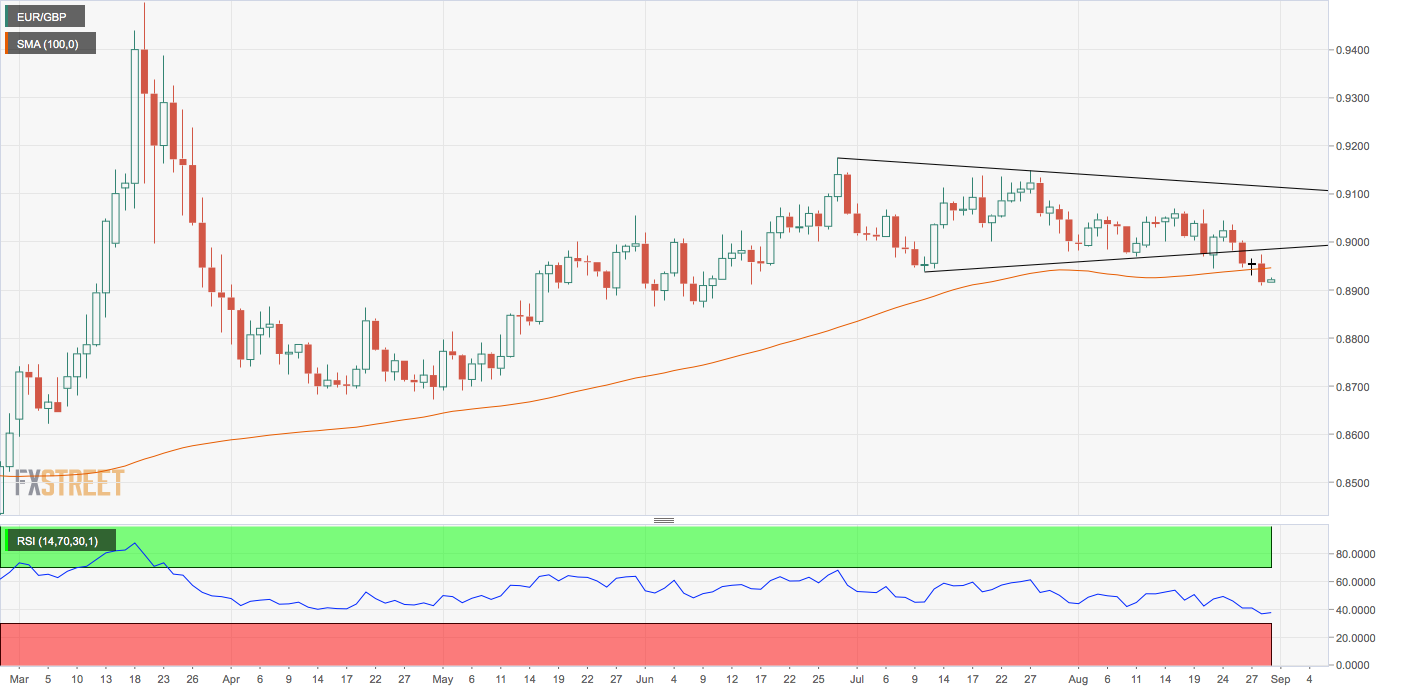
- EUR/GBP has breached the 100-day simple moving average support.
- The pair’s daily chart shows a bearish reversal pattern.
EUR/GBP is trading below its 100-day simple moving average (SMA) for the first time since February.
The pair is trading at 0.8922 at press time, and the 100-day SMA is located at 0.8944.
Acceptance below the key average has bolstered the bullish-to-bearish trend change signaled by the daily chart contracting triangle breakdown confirmed on Friday.
The 14-day relative strength index is also reporting a bearish bias with a below-50 print.
As such, a more profound decline to support at 0.8864 (June 9 low) looks likely. A move above the psychological level of 0.90 is needed to invalidate the bearish case.
Daily chart
Trend: Bearish
Technical levels
