- The EUR/GBP pair is presently trading around 0.8580 ahead of European markets open on Friday.
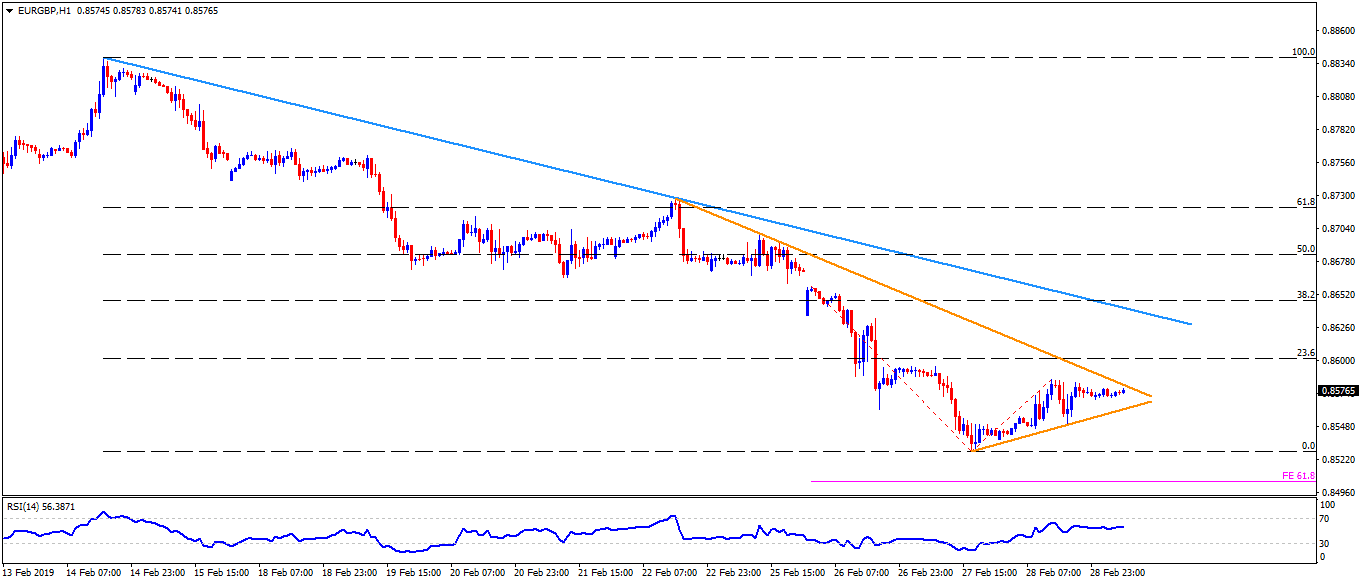
- The pair is near to a weeklong downward sloping trend-line connecting highs of February 22 and 25, at 0.8585, that holds the gate for its rise in a direction to 0.8630.
- However, another descending resistance-line, which joins February 14 and 22 high around 0.8640, could challenge the buyers afterward.
- In a case when prices rally past-0.8640, 0.8670 and 0.8700 could mark their appearance on the chart.
- Meanwhile, 0.8565 and an ascending support-line, at 0.8560, seem adjacent supports for the pair, a break of which can drag the pair to 0.8645 and 0.8630.
- It should also be noted that the pair’s declines under 0.8630 may have tough time conquering 61.8% Fibonacci expansion of its moves since Feb. 26, near 0.8500.
EUR/GBP hourly chart
Additional importtant levels:
Overview:
Today Last Price: 0.858
Today Daily change: 4 pips
Today Daily change %: 0.05%
Today Daily Open: 0.8576
Trends:
Daily SMA20: 0.8722
Daily SMA50: 0.8821
Daily SMA100: 0.8843
Daily SMA200: 0.886
Levels:
Previous Daily High: 0.8586
Previous Daily Low: 0.8536
Previous Weekly High: 0.8768
Previous Weekly Low: 0.8665
Previous Monthly High: 0.8842
Previous Monthly Low: 0.8529
Daily Fibonacci 38.2%: 0.8567
Daily Fibonacci 61.8%: 0.8555
Daily Pivot Point S1: 0.8546
Daily Pivot Point S2: 0.8516
Daily Pivot Point S3: 0.8496
Daily Pivot Point R1: 0.8596
Daily Pivot Point R2: 0.8617
Daily Pivot Point R3: 0.8647
