- A sustained break of multi-month resistance-line propels EUR/GBP to nearly two-year highs.
- Overbought RSI might trigger the pair’s pullback to January tops. Though, bears are stopped unless clearing resistance-turned-support.
Extending its break of 23-month old descending trend-line resistance, EUR/GBP surges to the highest since September 2017 as it takes the bids to 0.9187 ahead of the Europe markets’ open on Tuesday.
The pair now aims for the year 2017 top surrounding 0.9308 with August 2017 high near 0.9270 acting as an intermediate halt during the additional rise.
Against the move is overbought condition of 14-bar relative strength index (RSI), which in turn highlights the importance of January month top near 0.9120 as immediate support.
If prices slip beneath 0.9120, 23.6% Fibonacci retracement of the year 2016 upside, at 0.9062, followed by the resistance-turned-support-line close to 0.9045, can entertain sellers.
EUR/GBP weekly chart
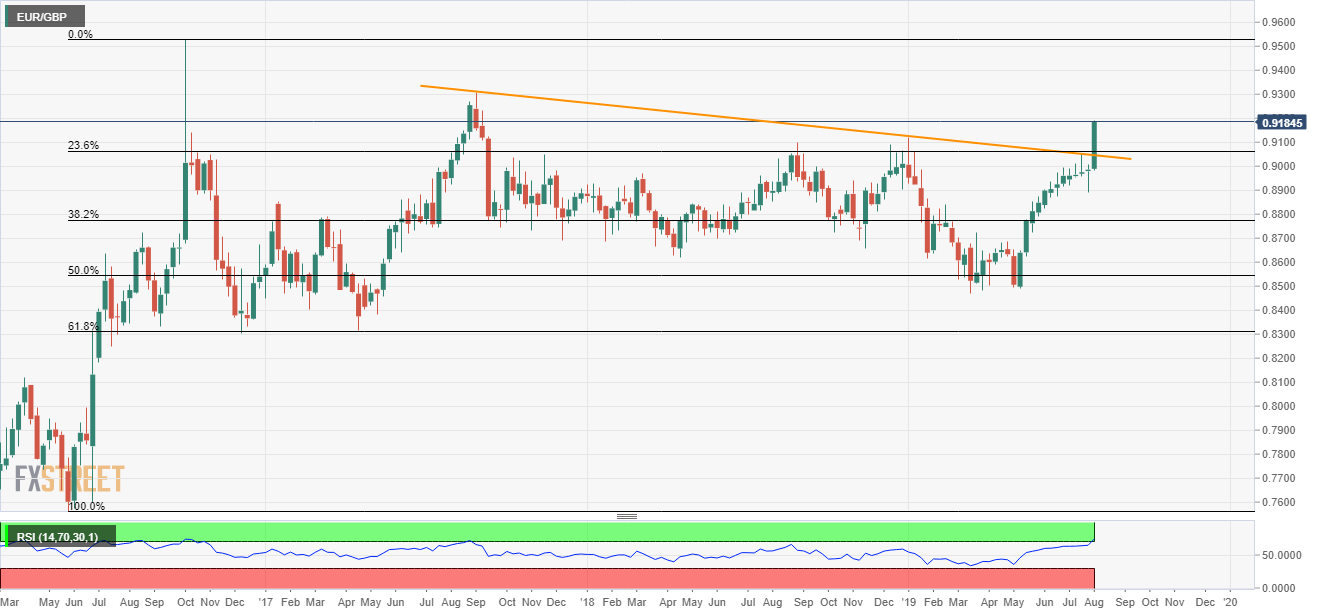
Trend: Bullish
