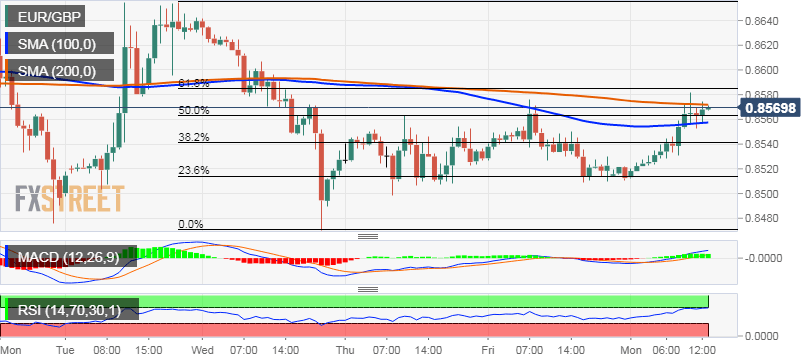
“¢ After Friday’s sharp intraday pull-back, the cross regained positive traction on the first trading day of the week and is now looking to extend the momentum beyond 200-hour SMA.
“¢ The fact that the cross managed to find acceptance above 100-hour SMA and 50% Fibo. level of the 0.8655-0.8471 slide turned out to be a key trigger for intraday bullish traders.
“¢ Bullish oscillators on the 1-hourly chart remained supportive of the up-move but are gradually moving into slightly overbought territory and might keep a lid on further gains.
“¢ Moreover, technical indicators on the daily chart are yet to catch up with the positive momentum and further warrant caution before placing any aggressive near-term bullish bets.
“¢ Hence, it would be prudent to wait for a sustained strength beyond 61.8% Fibo. level for a follow-through move beyond the 0.8600 handle towards testing the 0.8630-35 supply zone.
EUR/GBP 1-hourly chart
EUR/GBP
Overview:
Today Last Price: 0.8568
Today Daily change %: 0.54%
Today Daily Open: 0.8522
Trends:
Daily SMA20: 0.861
Daily SMA50: 0.8728
Daily SMA100: 0.8816
Daily SMA200: 0.885
Levels:
Previous Daily High: 0.8576
Previous Daily Low: 0.8509
Previous Weekly High: 0.8678
Previous Weekly Low: 0.847
Previous Monthly High: 0.8842
Previous Monthly Low: 0.8529
Daily Fibonacci 38.2%: 0.8535
Daily Fibonacci 61.8%: 0.855
Daily Pivot Point S1: 0.8496
Daily Pivot Point S2: 0.8469
Daily Pivot Point S3: 0.8429
Daily Pivot Point R1: 0.8563
Daily Pivot Point R2: 0.8603
Daily Pivot Point R3: 0.863
