“¢ The cross struggled to build on overnight bullish breakthrough a nine-month-old descending trend-line resistance and has now snapped four consecutive days of winning streak.
“¢ The corrective fall has now dragged the pair below a short-term ascending trend-line on the 1-hourly chart, albeit bulls have managed to hold the cross above 50-hour SMA support.
“¢ A subsequent below 23.6% Fibonacci retracement level of the 0.8817-0.8958 this week’s upsurge might prompt some additional long-unwinding trade on the last trading day of the week.
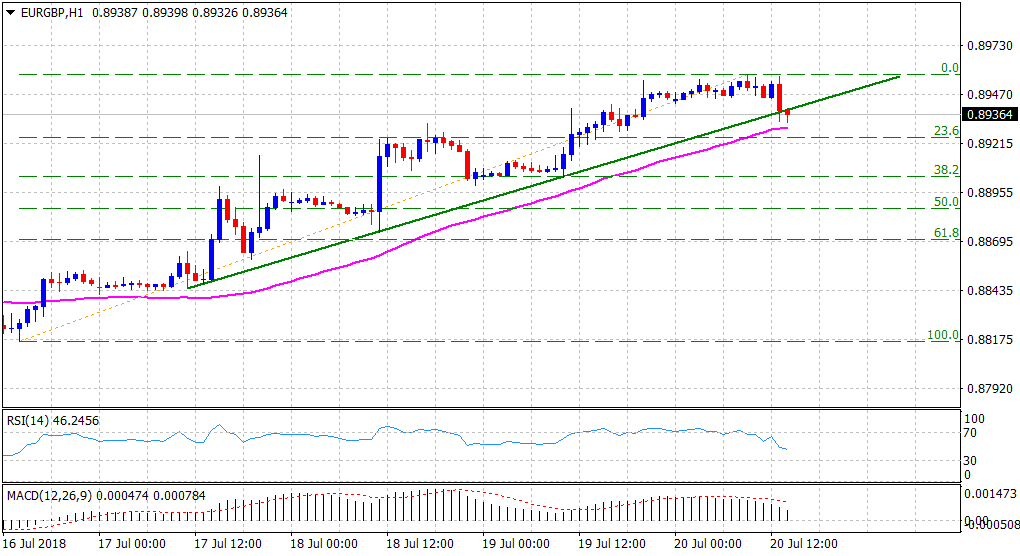
Spot rate: 0.8936
Daily High: 0.8958
Trend: Short-term bearish
Resistance
R1: 0.8958 (current day swing high)
R2: 0.8989 (R2 daily pivot-point)
R3: 0.9000 (psychological round figure mark)
Support
S1: 0.8913 (9-month old trend-line resistance break-point)
S2: 0.8881 (S2 daily pivot-point)
S3: 0.8822 (200-day SMA)
