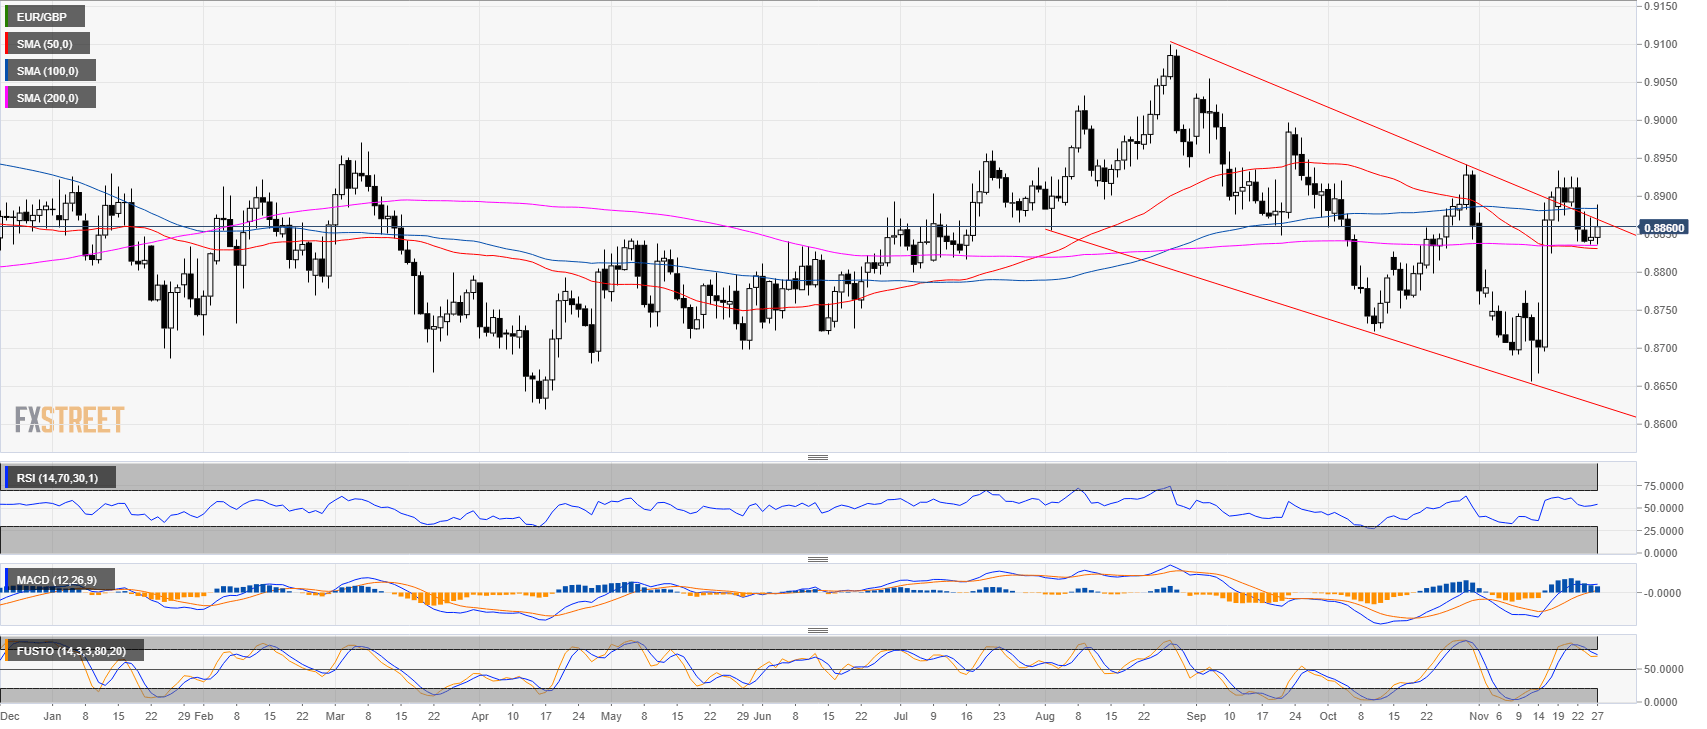
EUR/GBP daily chart
- EUR/GBP is trading just above its 50 and 200-day simple moving averages (SMAs).
- The market is rejecting the 100 SMA.
- Technical indicators keep a somewhat positive outlook.
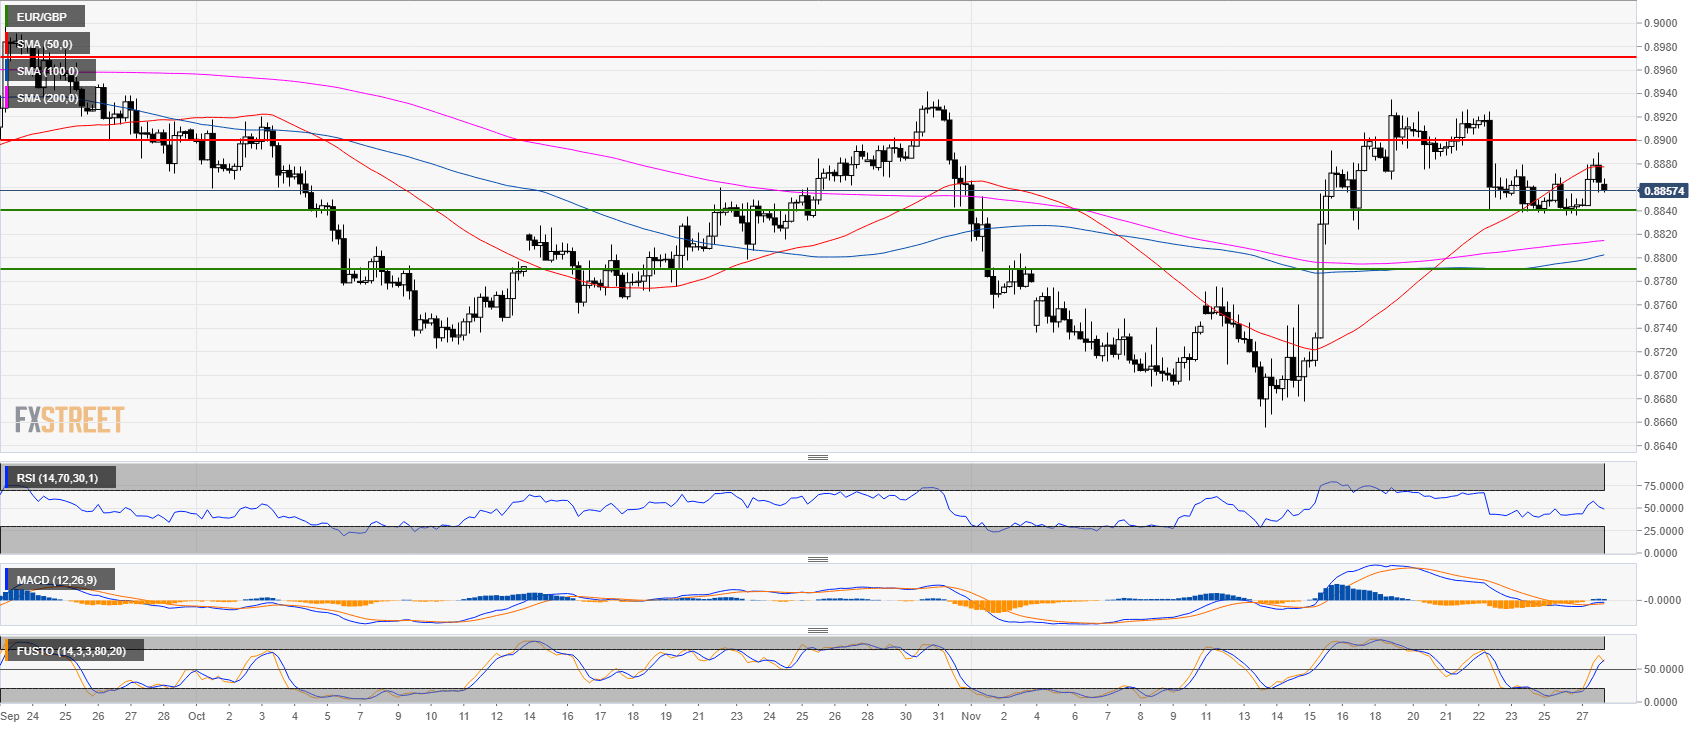
EUR/GBP 4-hour chart
- EUR/GBP tried to reach the 0.8900 figure but the 50 SMA blocked the intrady advance.
- The technical picture is weakening for bulls as another attempts to break below 0.8840 support can lead to a drop to 0.8790 support.
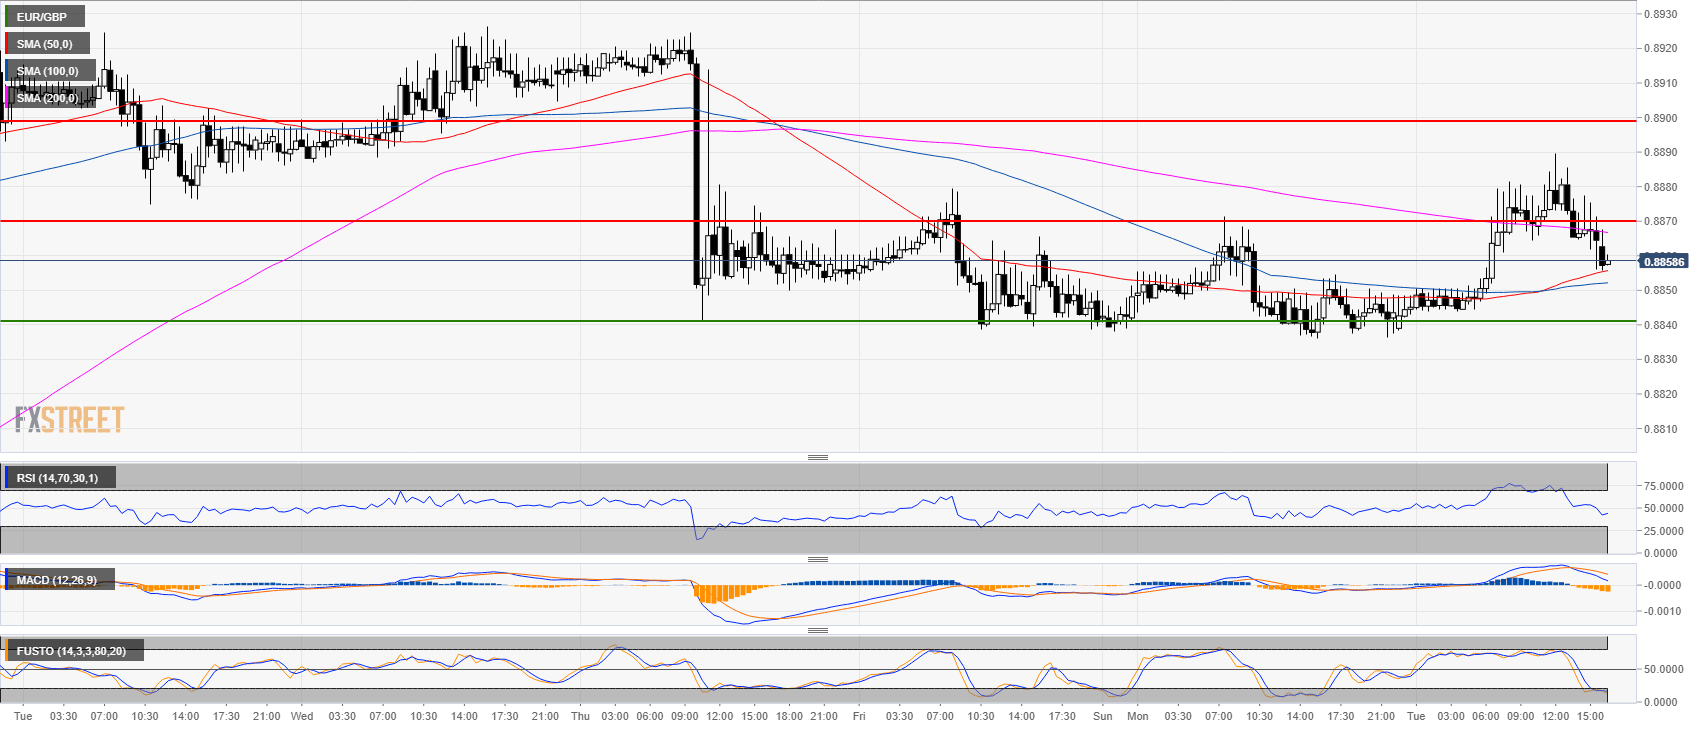
EUR/GBP 30-minute chart
- EUR/GBP is trapped between the 50-100 SMA and the 200 SMA.
- EUR/GBP is set to remain in the current daily range for the remainder of the New York session.
Additional key levels
EUR/GBP
Overview:
Today Last Price: 0.886
Today Daily change: 14 pips
Today Daily change %: 0.158%
Today Daily Open: 0.8846
Trends:
Previous Daily SMA20: 0.8807
Previous Daily SMA50: 0.8831
Previous Daily SMA100: 0.8884
Previous Daily SMA200: 0.8836
Levels:
Previous Daily High: 0.8872
Previous Daily Low: 0.8836
Previous Weekly High: 0.8934
Previous Weekly Low: 0.8839
Previous Monthly High: 0.8942
Previous Monthly Low: 0.8722
Previous Daily Fibonacci 38.2%: 0.8858
Previous Daily Fibonacci 61.8%: 0.885
Previous Daily Pivot Point S1: 0.8831
Previous Daily Pivot Point S2: 0.8816
Previous Daily Pivot Point S3: 0.8795
Previous Daily Pivot Point R1: 0.8866
Previous Daily Pivot Point R2: 0.8887
Previous Daily Pivot Point R3: 0.8902
