- EUR/GBP is trying to found some support above the 0.8900 figure after two corrective days.
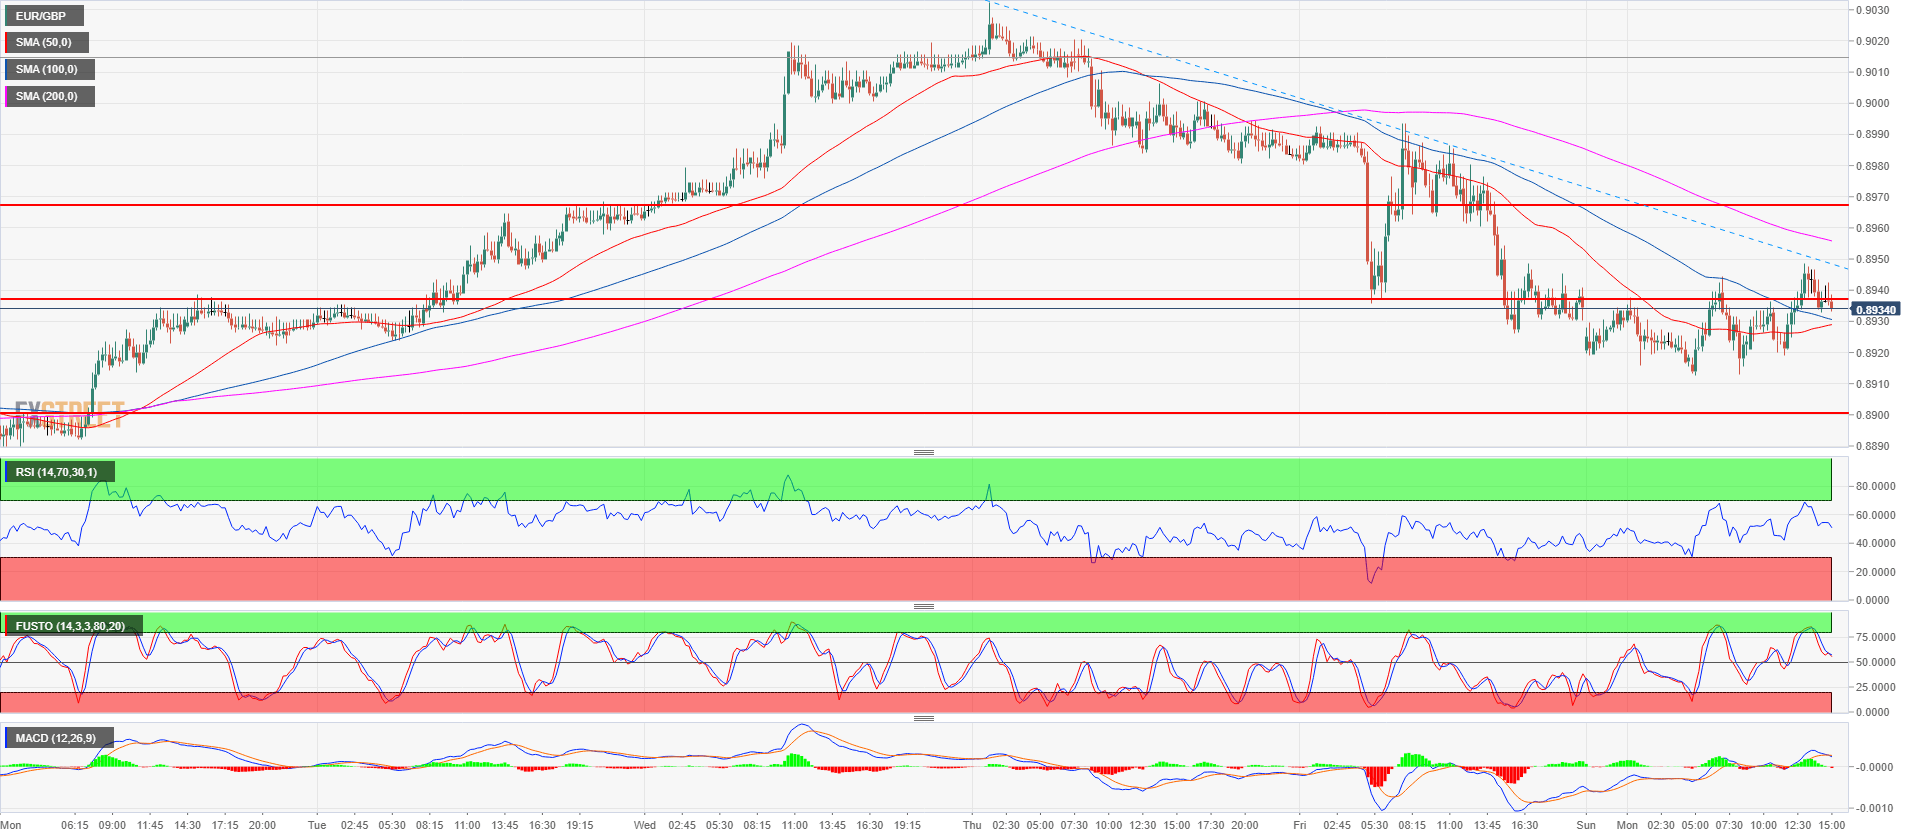
- EUR/GBP is trading above its 50 and 100-period simple moving average (SMA) on the 15-minute chart but bulls would need a cross-over of the 50 SMA above the 100 and 200 SMA in order to confirm the resumption of the bull trend. In addition, a breakout above the bearish trendline and 0.8957/67 area would further confirm the bullish bias.
- Supports are seen near 0.8900 and 0.8868, 13 July high.
EUR/GBP 15-minute chart
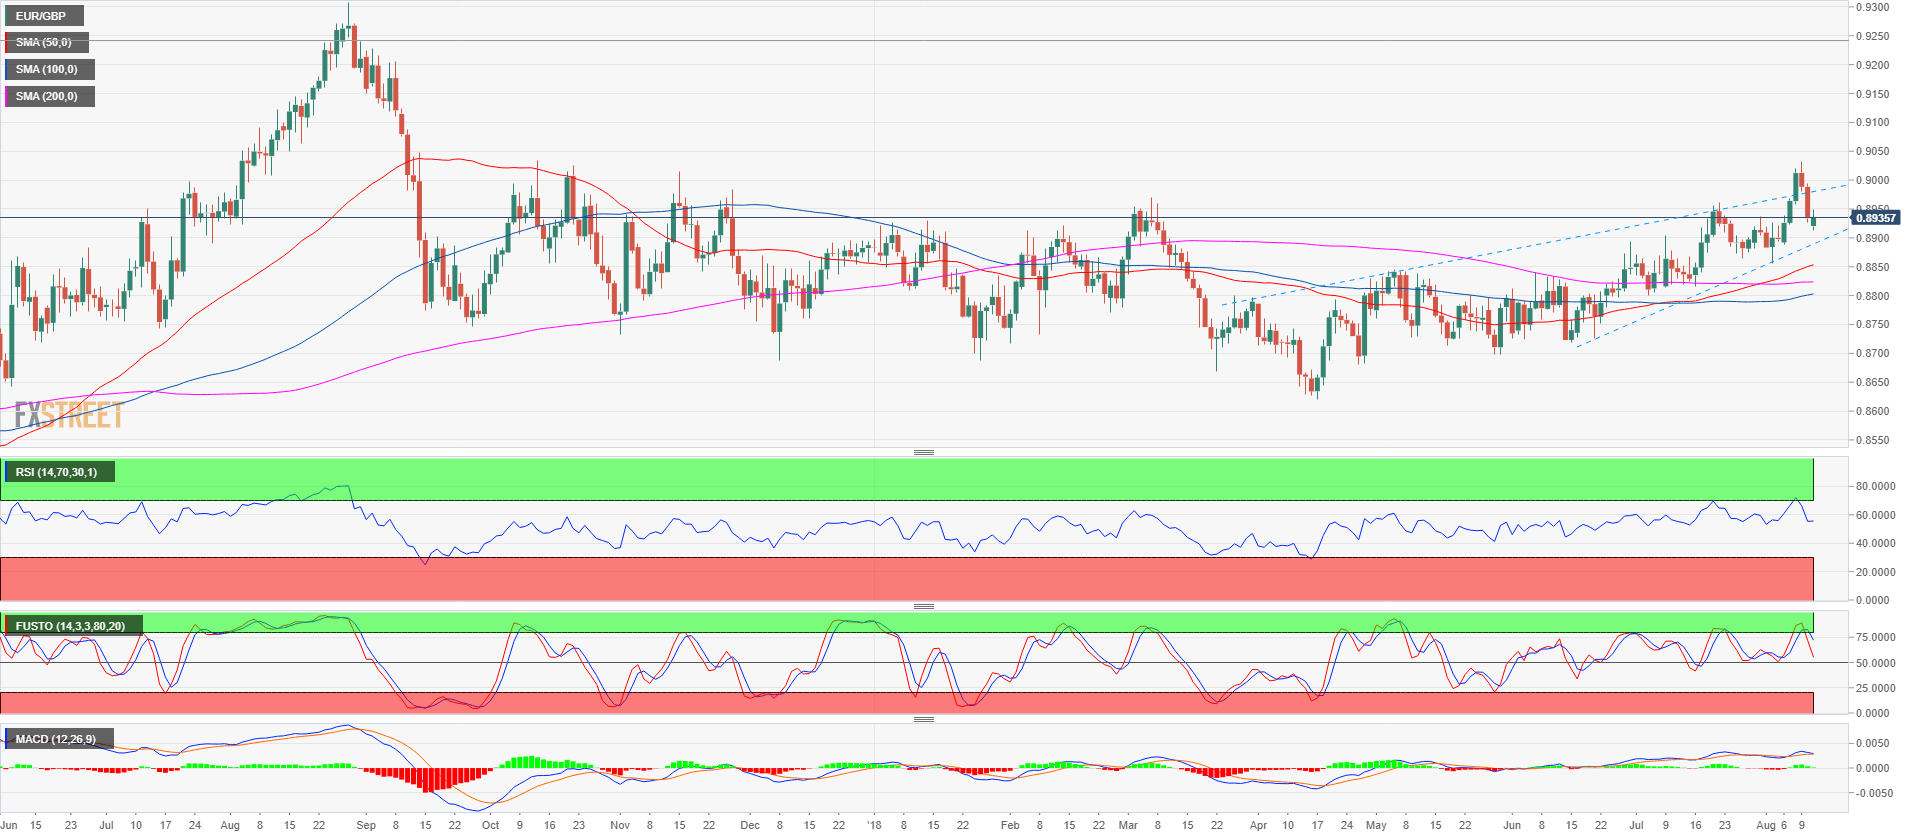
EUR/GBP daily chart
Spot rate: 0.8933
Relative change: 0.00%
High: 0.8948
Low: 0.8912
Main Trend: Bullish
Resistance 1: 0.8937 July 31 high
Resistance 2: 0.8957/67 area, July 20 high and March 7 high
Resistance 3: 0.9019 August 9 high
Resistance 4: 0.9109 September 8, 2017 low
Resistance 5: 0.9160 August 23, 2017 low
Support 1: 0.8920 supply level
Support 2: 0.8900 July 9 high
Support 3: 0.8868, 13 July high
Support 4: 0.8840 supply level
Support 5: 0.8820-0.8840 area, 200-day SMA
Support 6: 0.8800 figure
Support 7: 0.8780 daily 50-period SMA
Support 8: 0.8764 June 8 low
