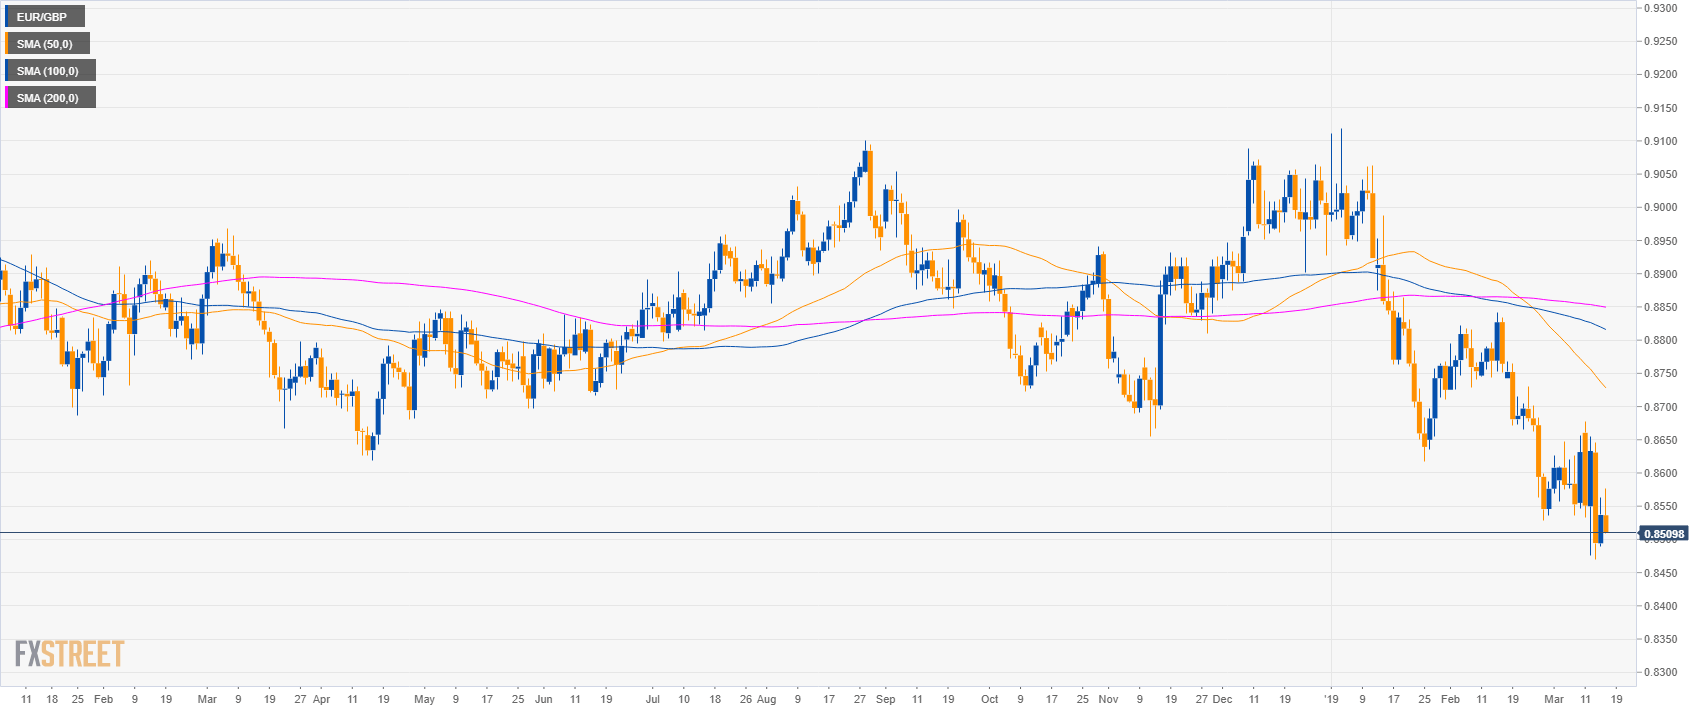
EUR/GBP daily
- EUR/GBP is trading in a sideways trend below its main simple moving averages (SMAs).
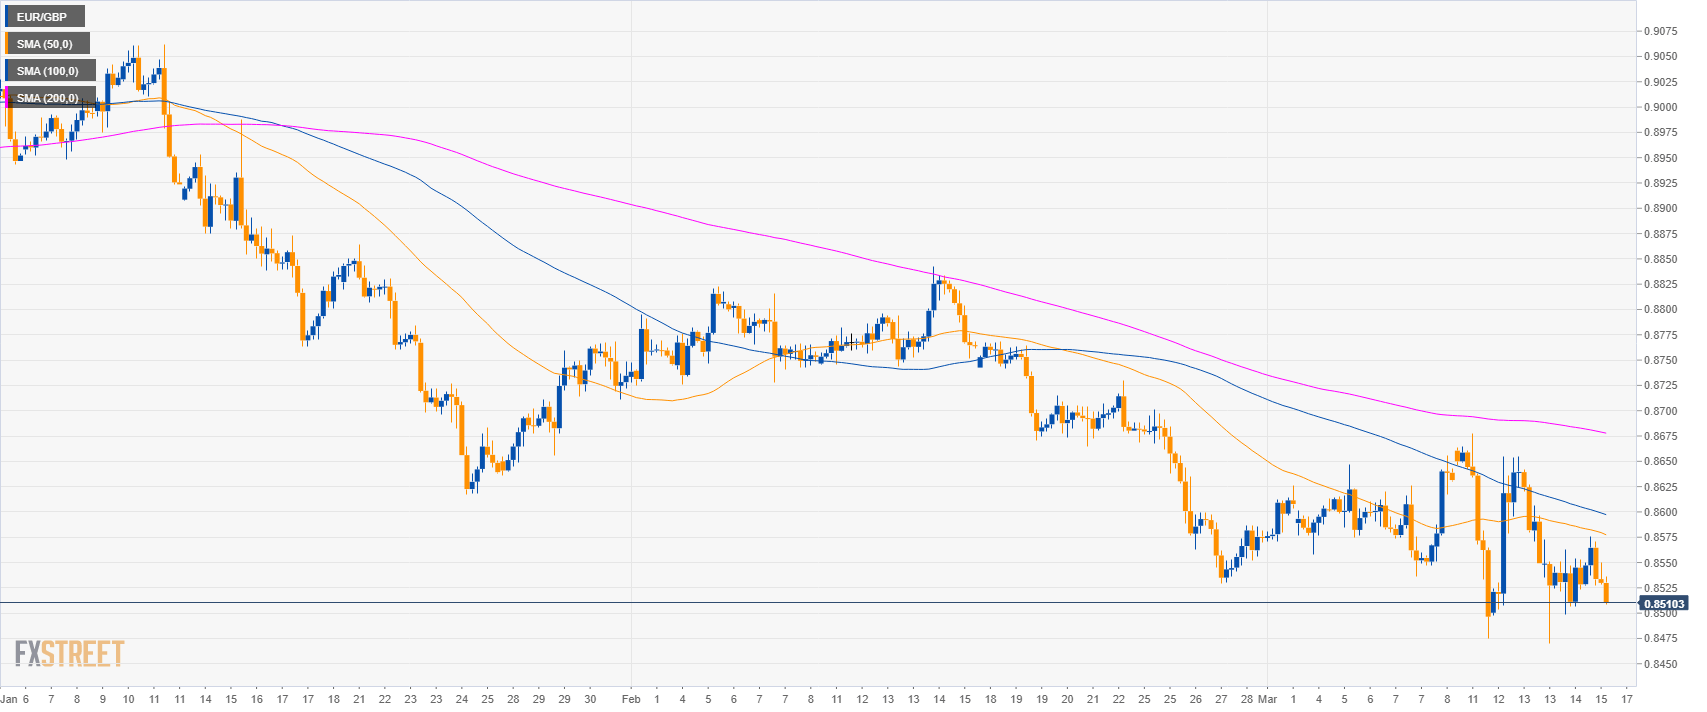
EUR/GBP 4-hour chart
- EUR/GBP is trading below the main SMAs suggesting a bearish bias in the medium-term.
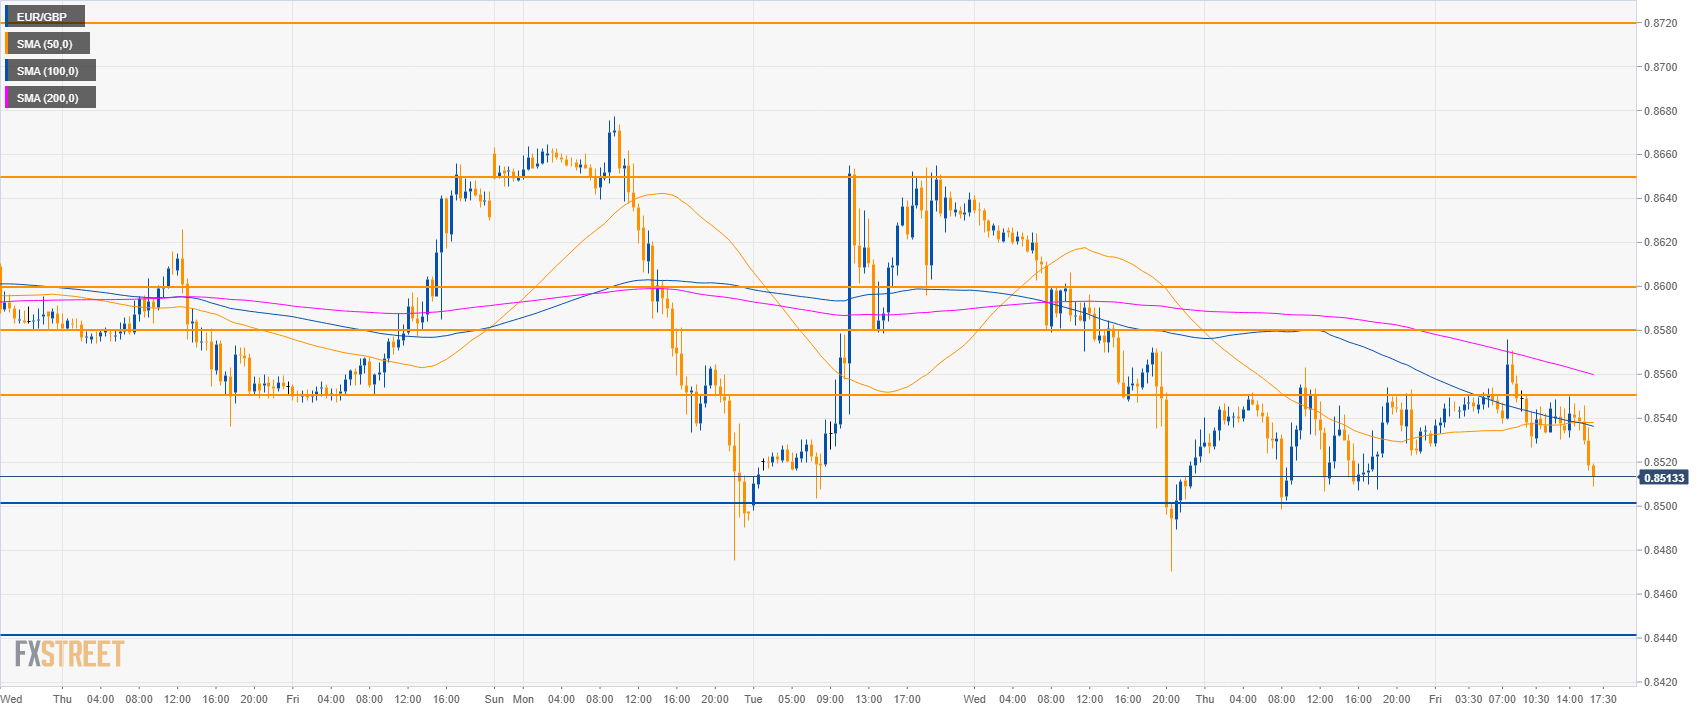
EUR/GBP 30-minute chart
- EUR/GBP is trading below its main SMAs suggesting bearish momentum in the short-term.
- A break below 0.8500 might lead to an extension of the current drop to 0.8440 support.
- Resistances are seen at 0.8550, 0.8580 and 0.8650 level.
Additional key levels
EUR/GBP
Overview:
Today Last Price: 0.851
Today Daily change: -27 pips
Today Daily change %: -0.32%
Today Daily Open: 0.8537
Trends:
Daily SMA20: 0.8622
Daily SMA50: 0.8737
Daily SMA100: 0.882
Daily SMA200: 0.8851
Levels:
Previous Daily High: 0.8563
Previous Daily Low: 0.8489
Previous Weekly High: 0.8656
Previous Weekly Low: 0.8536
Previous Monthly High: 0.8842
Previous Monthly Low: 0.8529
Daily Fibonacci 38.2%: 0.8535
Daily Fibonacci 61.8%: 0.8517
Daily Pivot Point S1: 0.8496
Daily Pivot Point S2: 0.8456
Daily Pivot Point S3: 0.8423
Daily Pivot Point R1: 0.857
Daily Pivot Point R2: 0.8603
Daily Pivot Point R3: 0.8644
