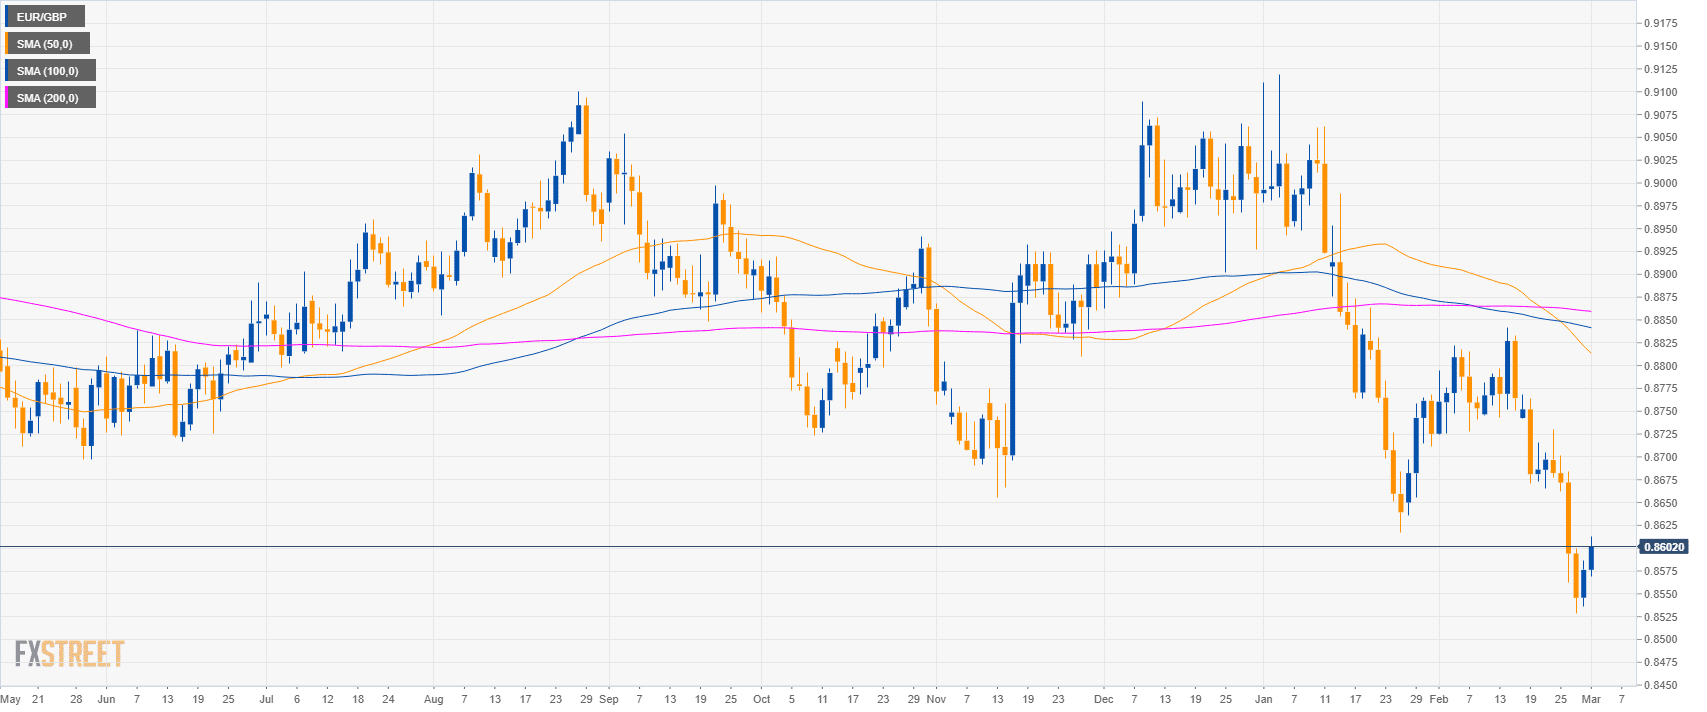
EUR/GBP daily chart
- EUR/GBP is in a sideways trend below its main simple moving averages (SMAs).
- As forecast, EUR/GBP found strong support at the 0.8530 level to the pip.
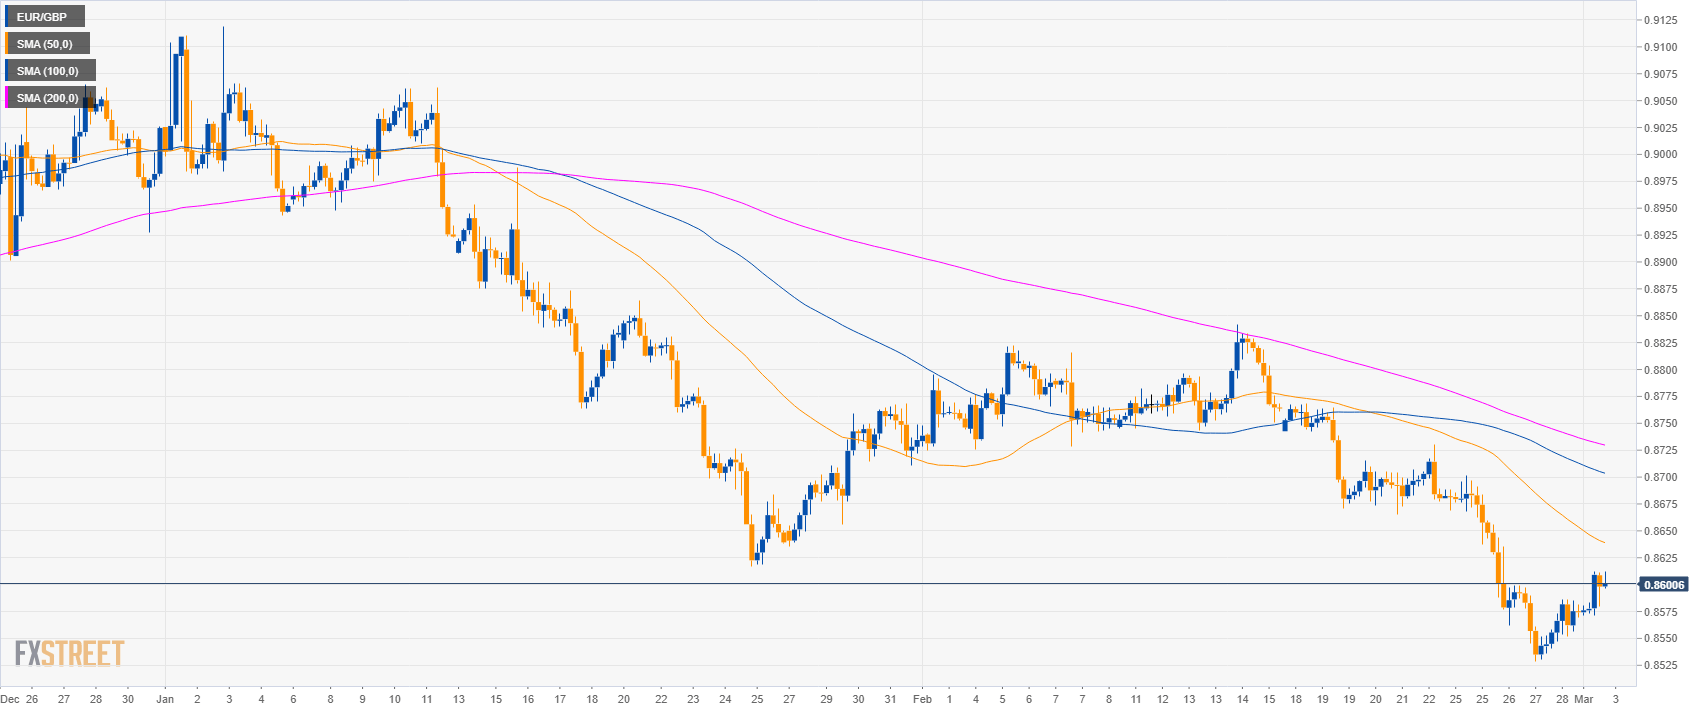
EUR/GBP 4-hour chart
- EUR/GBP is below its main SMAs suggesting bearish momentum in the medium-term.
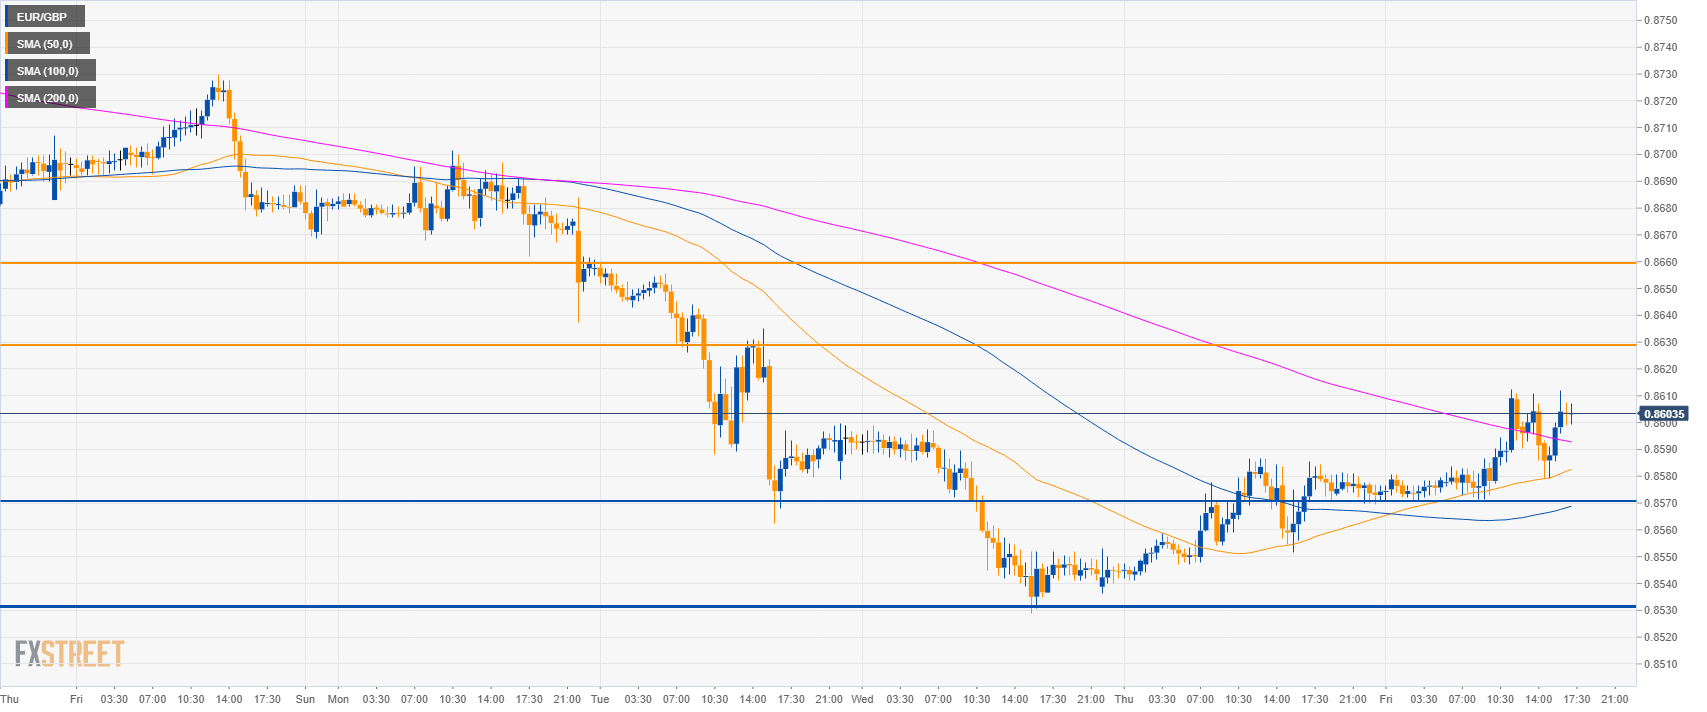
EUR/GBP 30-minute chart
- EUR/GBP Is trading above its main SMAs suggesting bullish momentum.
- The target to the upside is 0.8630 and possibly 0.8660 if bulls gather enough steam.
- Support is 0.8570 and 0.8530 level.
Additional key levels
EUR/GBP
Overview:
Today Last Price: 0.8601
Today Daily change: 25 pips
Today Daily change %: 0.29%
Today Daily Open: 0.8576
Trends:
Daily SMA20: 0.8722
Daily SMA50: 0.8821
Daily SMA100: 0.8843
Daily SMA200: 0.886
Levels:
Previous Daily High: 0.8586
Previous Daily Low: 0.8536
Previous Weekly High: 0.8768
Previous Weekly Low: 0.8665
Previous Monthly High: 0.8842
Previous Monthly Low: 0.8529
Daily Fibonacci 38.2%: 0.8567
Daily Fibonacci 61.8%: 0.8555
Daily Pivot Point S1: 0.8546
Daily Pivot Point S2: 0.8516
Daily Pivot Point S3: 0.8496
Daily Pivot Point R1: 0.8596
Daily Pivot Point R2: 0.8617
Daily Pivot Point R3: 0.8647
