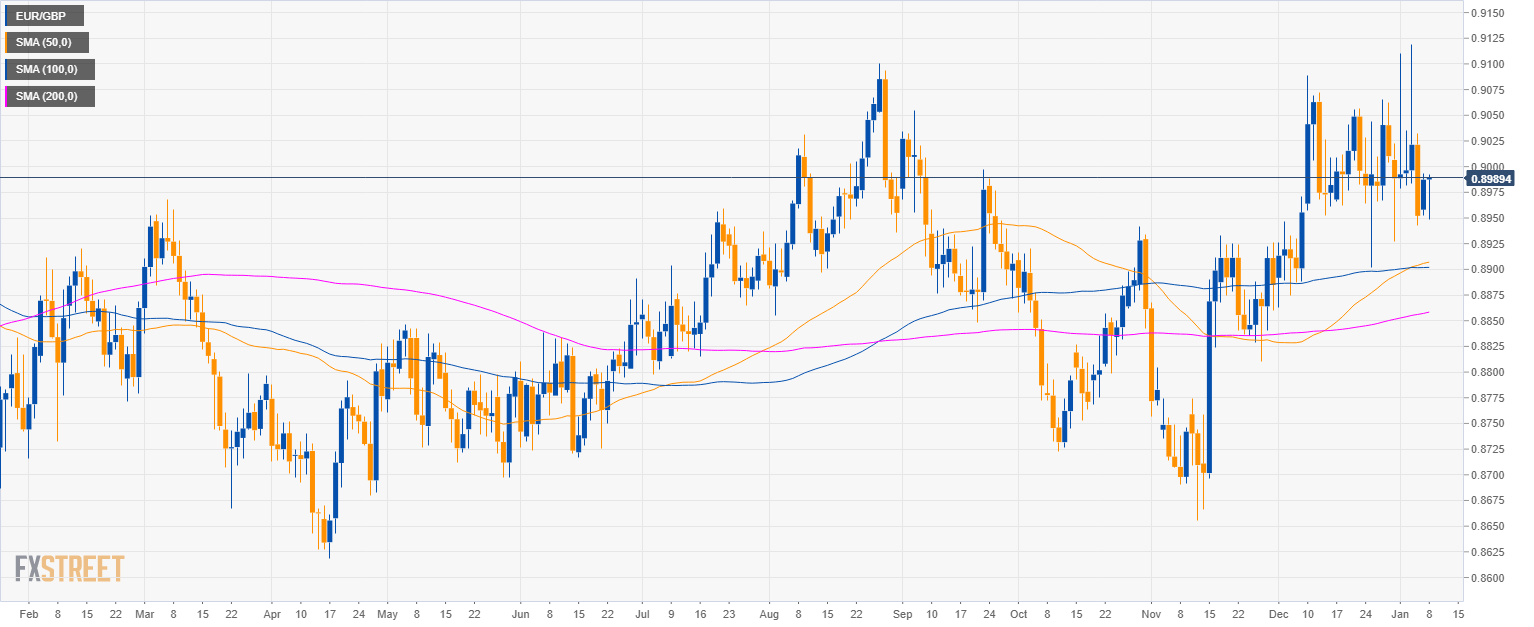
EUR/GBP daily chart
- EUR/GBP is trading in a sideways trend above the 200-period simple moving average (SMA).
- The market has been mainly undecided since December 2018.
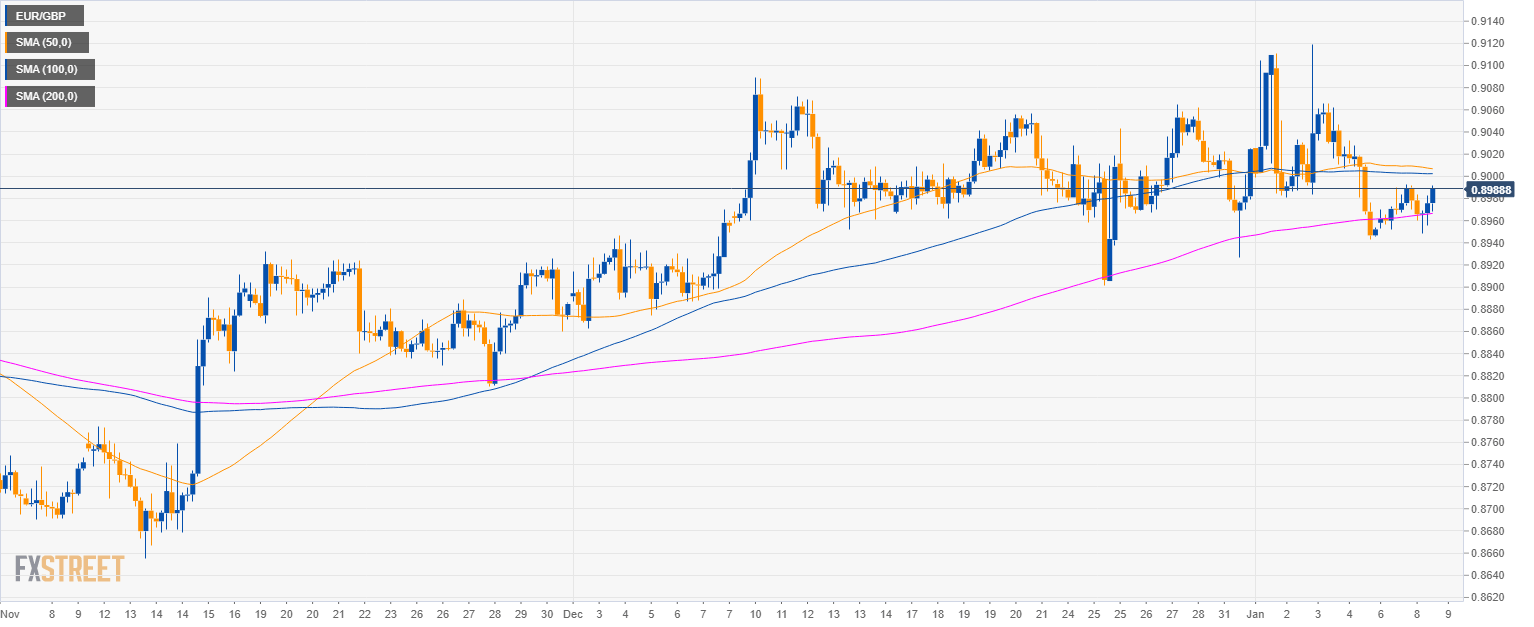
EUR/GBP 4-hour chart
- EUR/GBP is trading between the 100 and 200 SMAs.
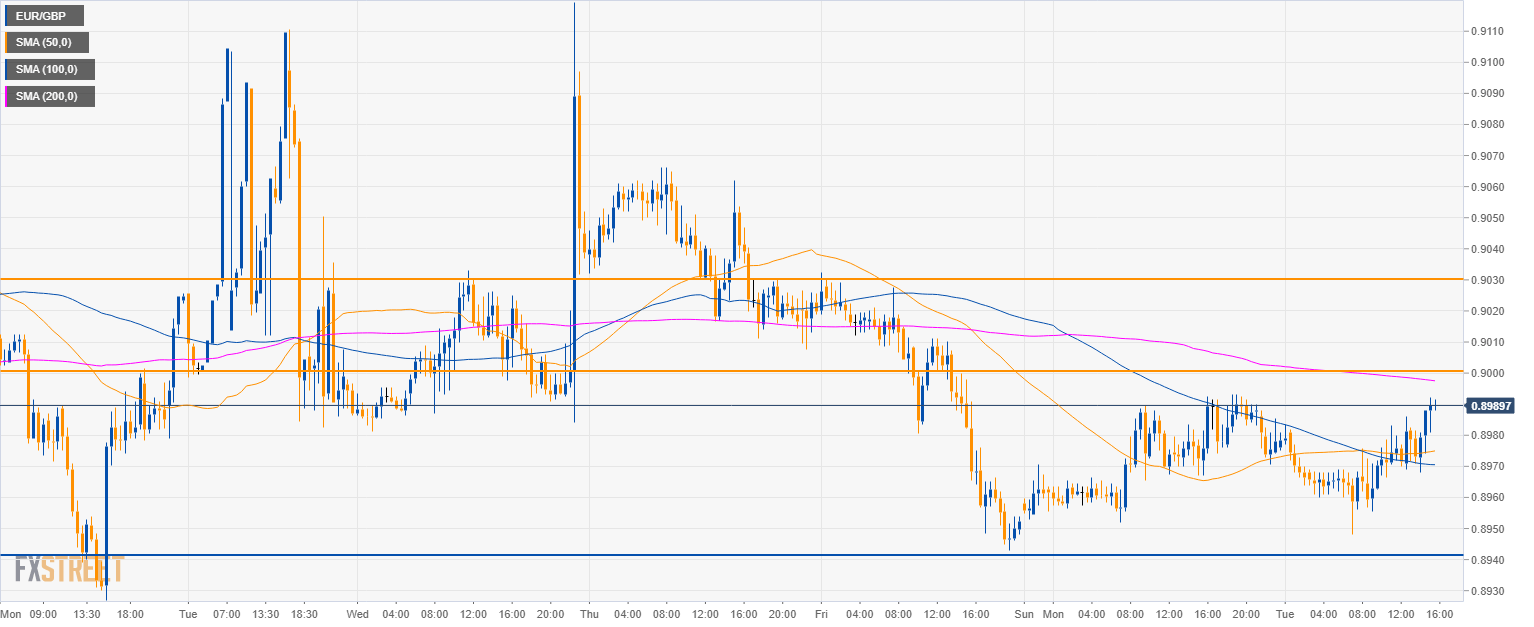
EUR/GBP 30-minute chart
- Bulls need a break of the 0.9000 figure to reach 0.9030.
- On the flip side, failure to break above the 0.9000 figure and 200 SMA would likely see the market contained in the current range with 0.8940 as support.
Additional key levels
EUR/GBP
Overview:
Today Last Price: 0.8986
Today Daily change: -1.0 pips
Today Daily change %: -0.0111%
Today Daily Open: 0.8987
Trends:
Previous Daily SMA20: 0.8999
Previous Daily SMA50: 0.8906
Previous Daily SMA100: 0.8902
Previous Daily SMA200: 0.8857
Levels:
Previous Daily High: 0.8993
Previous Daily Low: 0.8952
Previous Weekly High: 0.9119
Previous Weekly Low: 0.8927
Previous Monthly High: 0.9089
Previous Monthly Low: 0.8863
Previous Daily Fibonacci 38.2%: 0.8977
Previous Daily Fibonacci 61.8%: 0.8968
Previous Daily Pivot Point S1: 0.8962
Previous Daily Pivot Point S2: 0.8936
Previous Daily Pivot Point S3: 0.8921
Previous Daily Pivot Point R1: 0.9003
Previous Daily Pivot Point R2: 0.9018
Previous Daily Pivot Point R3: 0.9044
