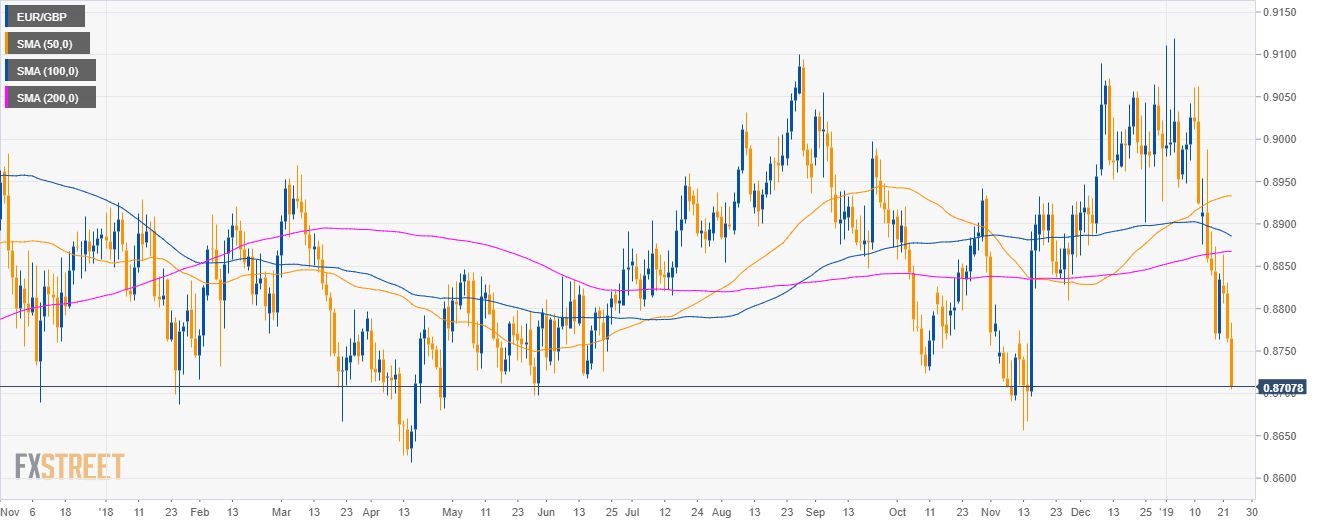
EUR/GBP daily chart
- EUR/GBP is trading in a sideways trend below the 50, 100 and 200-day simple moving averages (SMAs).
- As discussed, failure to hold price above the 0.8760 support lead to a drop to the 0.8710 level.
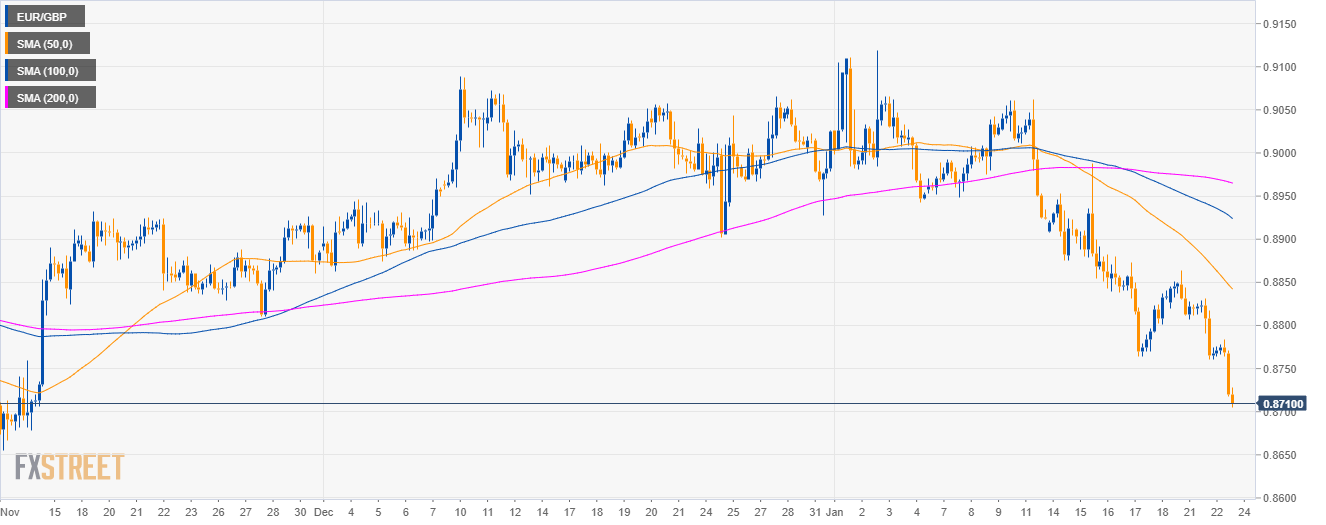
EUR/GBP 4-hour chart
- EUR/GBP is trading below the main SMAs as the currency cross is trading at new 2019 lows.
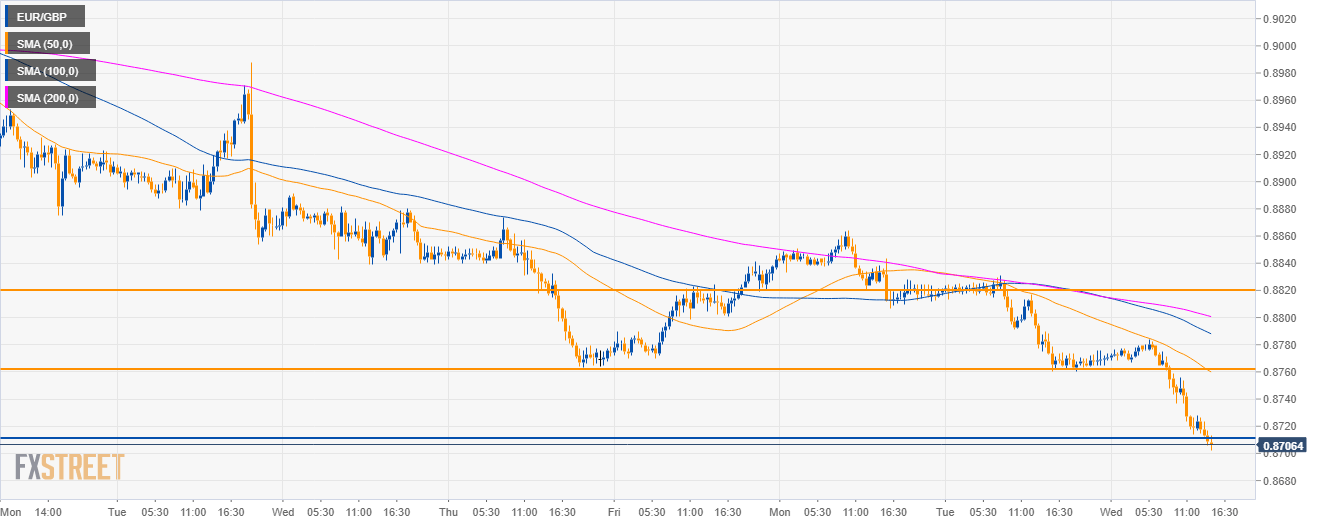
EUR/GBP 30-minute chart
- As EUR/GBP is trading below its main SMAs the bears are in control of the market.
- If the sellers can keep EUR/GBP below 0.8710 a drop to 0.6560 can be on the cards.
- On the flip side, bulls will try to reclaim the resistances near 0.8760 and the 0.8820 level.
Additional key levels
EUR/GBP
Overview:
Today Last Price: 0.8709
Today Daily change: -0.0056 pips
Today Daily change %: -0.64%
Today Daily Open: 0.8765
Trends:
Daily SMA20: 0.8937
Daily SMA50: 0.8933
Daily SMA100: 0.8889
Daily SMA200: 0.8867
Levels:
Previous Daily High: 0.8831
Previous Daily Low: 0.876
Previous Weekly High: 0.8988
Previous Weekly Low: 0.8764
Previous Monthly High: 0.9089
Previous Monthly Low: 0.8863
Daily Fibonacci 38.2%: 0.8787
Daily Fibonacci 61.8%: 0.8804
Daily Pivot Point S1: 0.874
Daily Pivot Point S2: 0.8714
Daily Pivot Point S3: 0.8669
Daily Pivot Point R1: 0.8811
Daily Pivot Point R2: 0.8856
Daily Pivot Point R3: 0.8882
