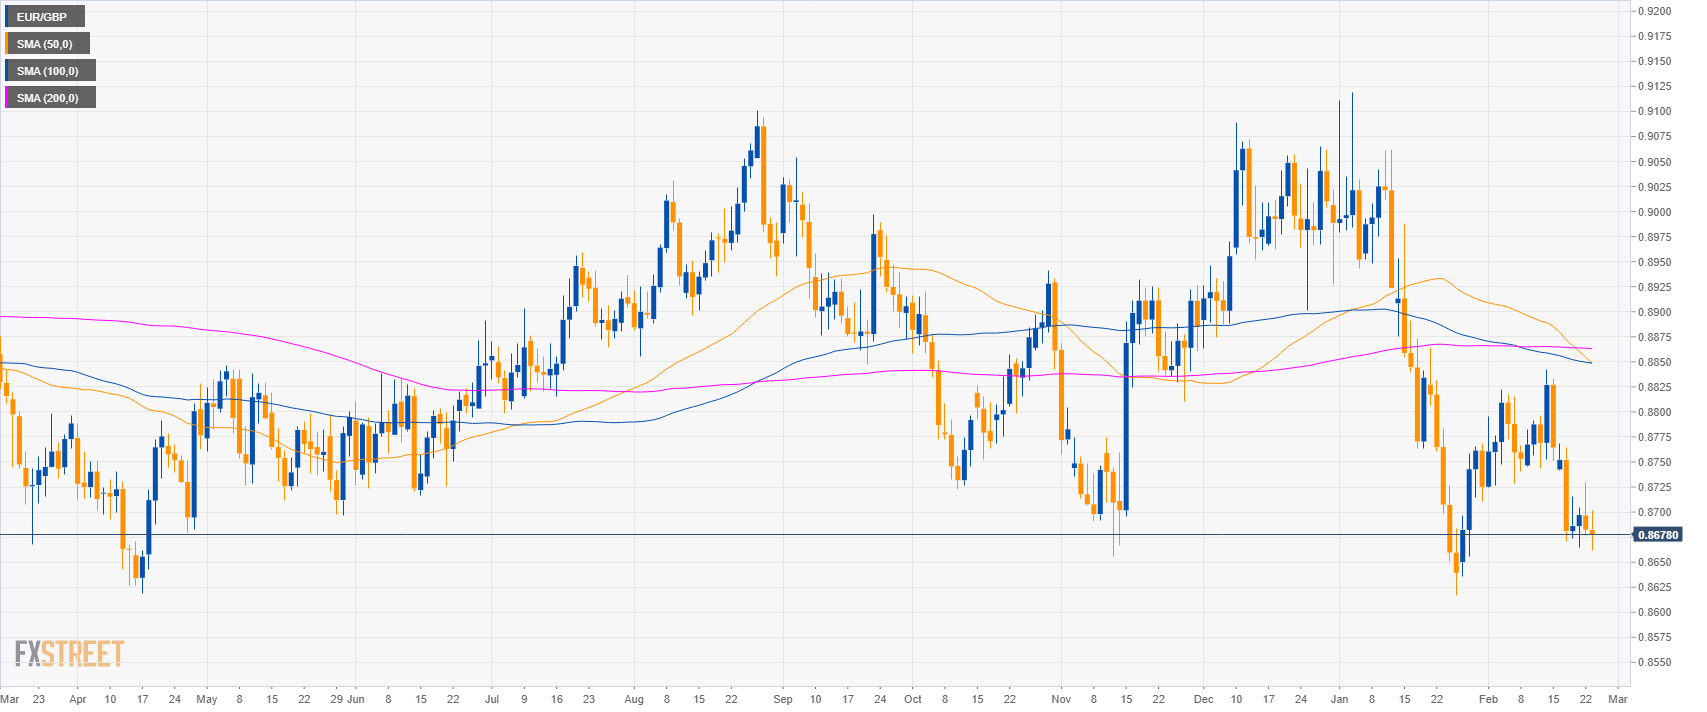
EUR/GBP daily chart
- EUR/GBP is in a sideways trend below its main simple moving averages (SMAs).
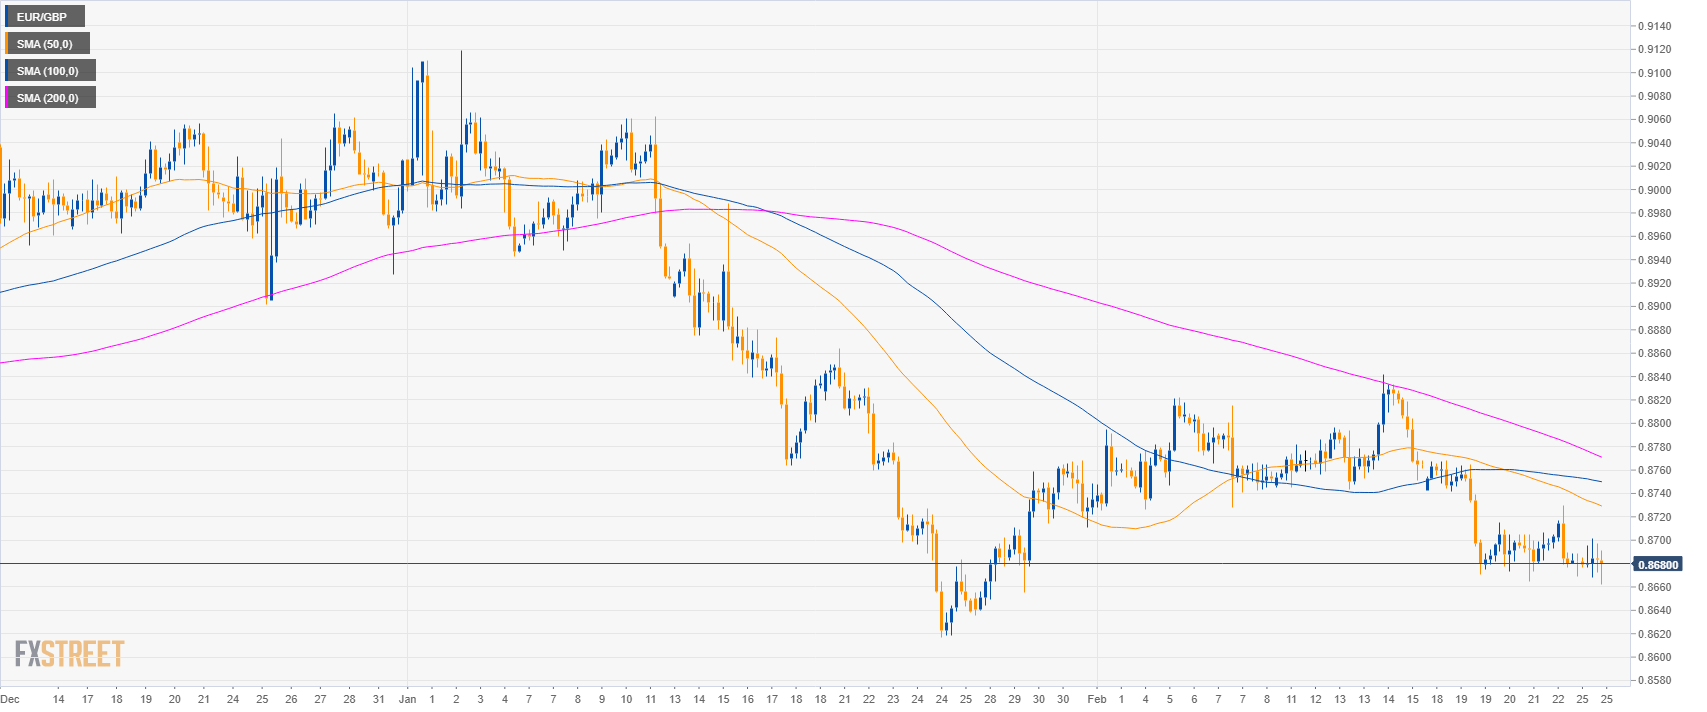
EUR/GBP 4-hour chart
- EUR/GBP is drifting down below its main SMAs suggesting bearish momentum in the medium-term.
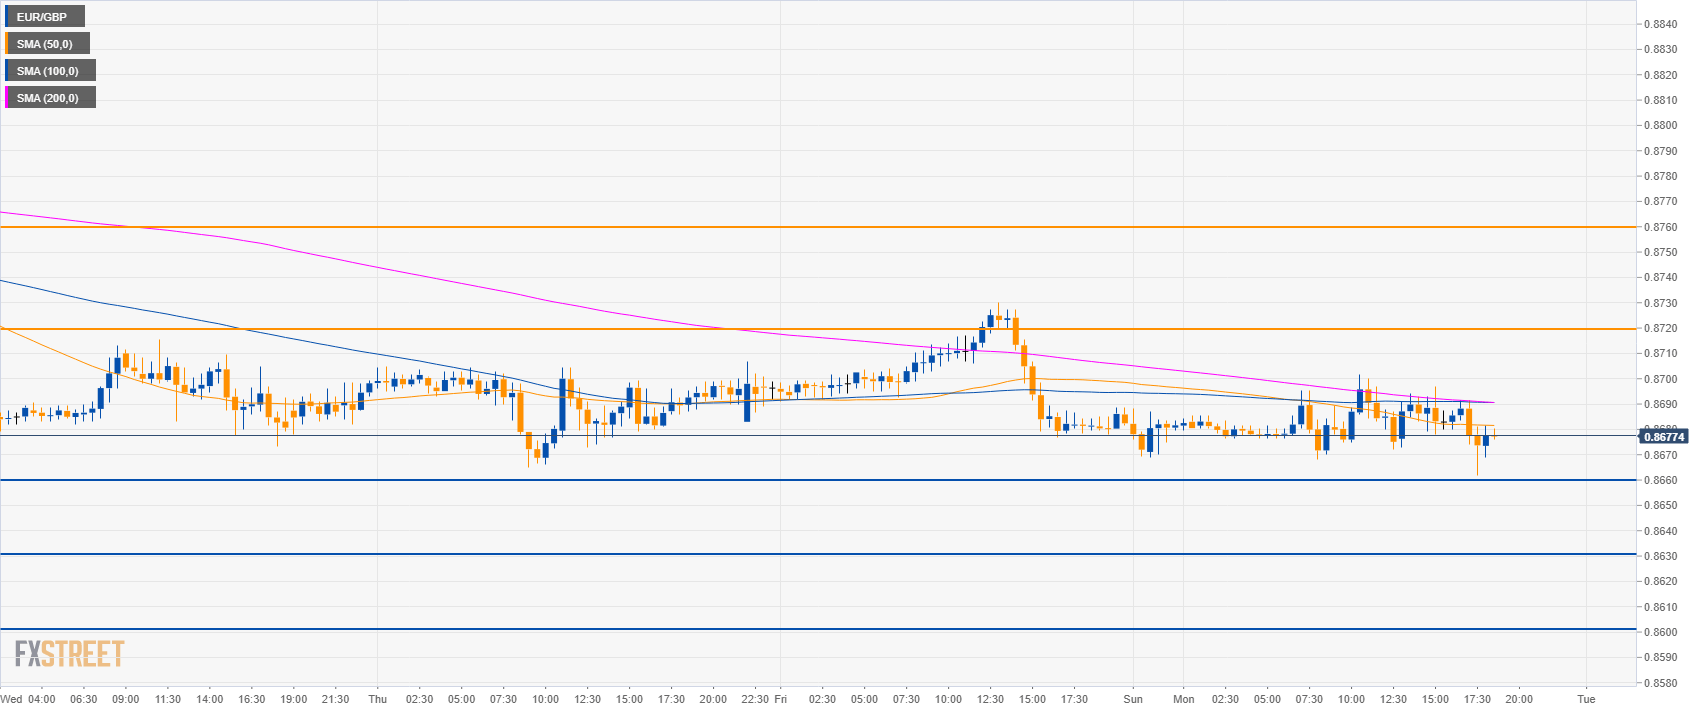
EUR/GBP 30-minute chart
- EUR/GBP is trading below the main SMAs suggesting bearish momentum in the short-term.
- EUR/GBP bears want to drive the market below 0.8680. A break below the level could lead to 0.8630 and 0.8600 level.
- To the upside, resistance is seen at 0.8720 and 0.8760 level.
Additional key levels
EUR/GBP
Overview:
Today Last Price: 0.8678
Today Daily change: -4 pips
Today Daily change %: -0.05%
Today Daily Open: 0.8682
Trends:
Daily SMA20: 0.8748
Daily SMA50: 0.8855
Daily SMA100: 0.885
Daily SMA200: 0.8864
Levels:
Previous Daily High: 0.873
Previous Daily Low: 0.8677
Previous Weekly High: 0.8768
Previous Weekly Low: 0.8665
Previous Monthly High: 0.9119
Previous Monthly Low: 0.8617
Daily Fibonacci 38.2%: 0.8697
Daily Fibonacci 61.8%: 0.871
Daily Pivot Point S1: 0.8663
Daily Pivot Point S2: 0.8643
Daily Pivot Point S3: 0.861
Daily Pivot Point R1: 0.8716
Daily Pivot Point R2: 0.8749
Daily Pivot Point R3: 0.8769
