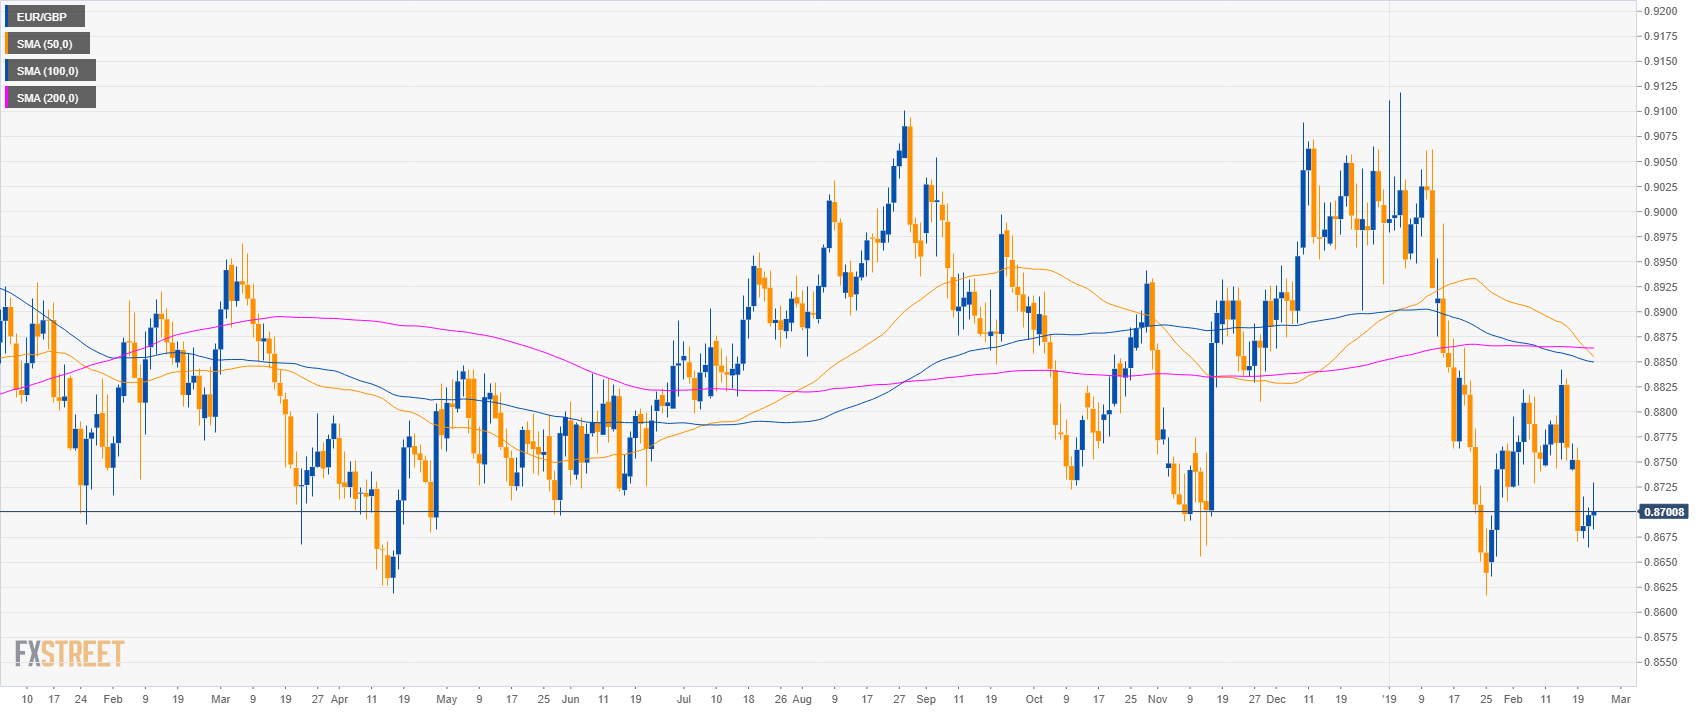
EUR/GBP daily chart
- EUR/GBP is trading near 0.8700 figure.
- EUR/GBP is in a sideways trend below the 200-day simple moving averages (SMA).
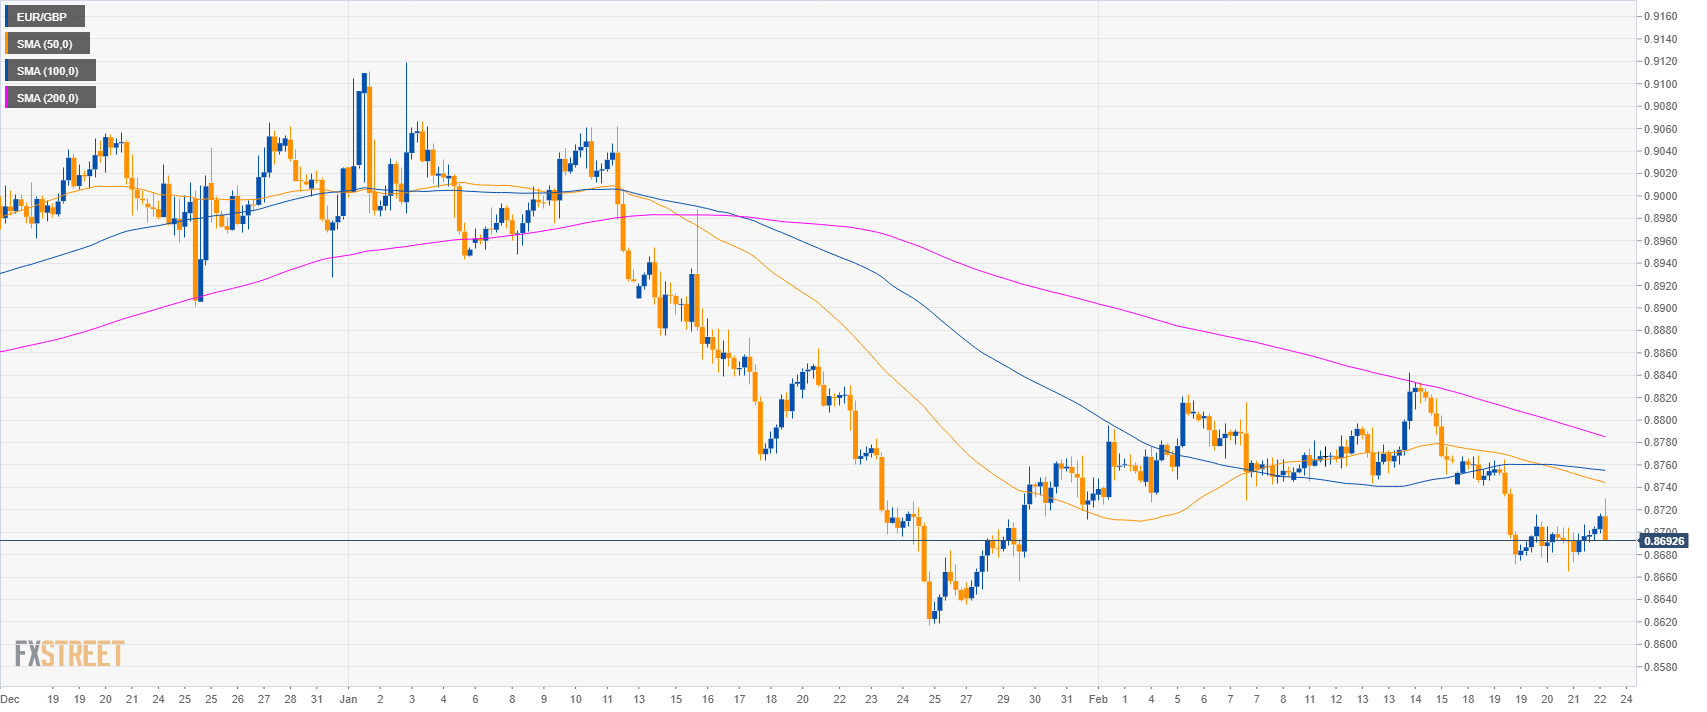
EUR/GBP 4-hour chart
- EUR/GBP is trading below the main SMAs suggesting a bearish bias in the medium-term.
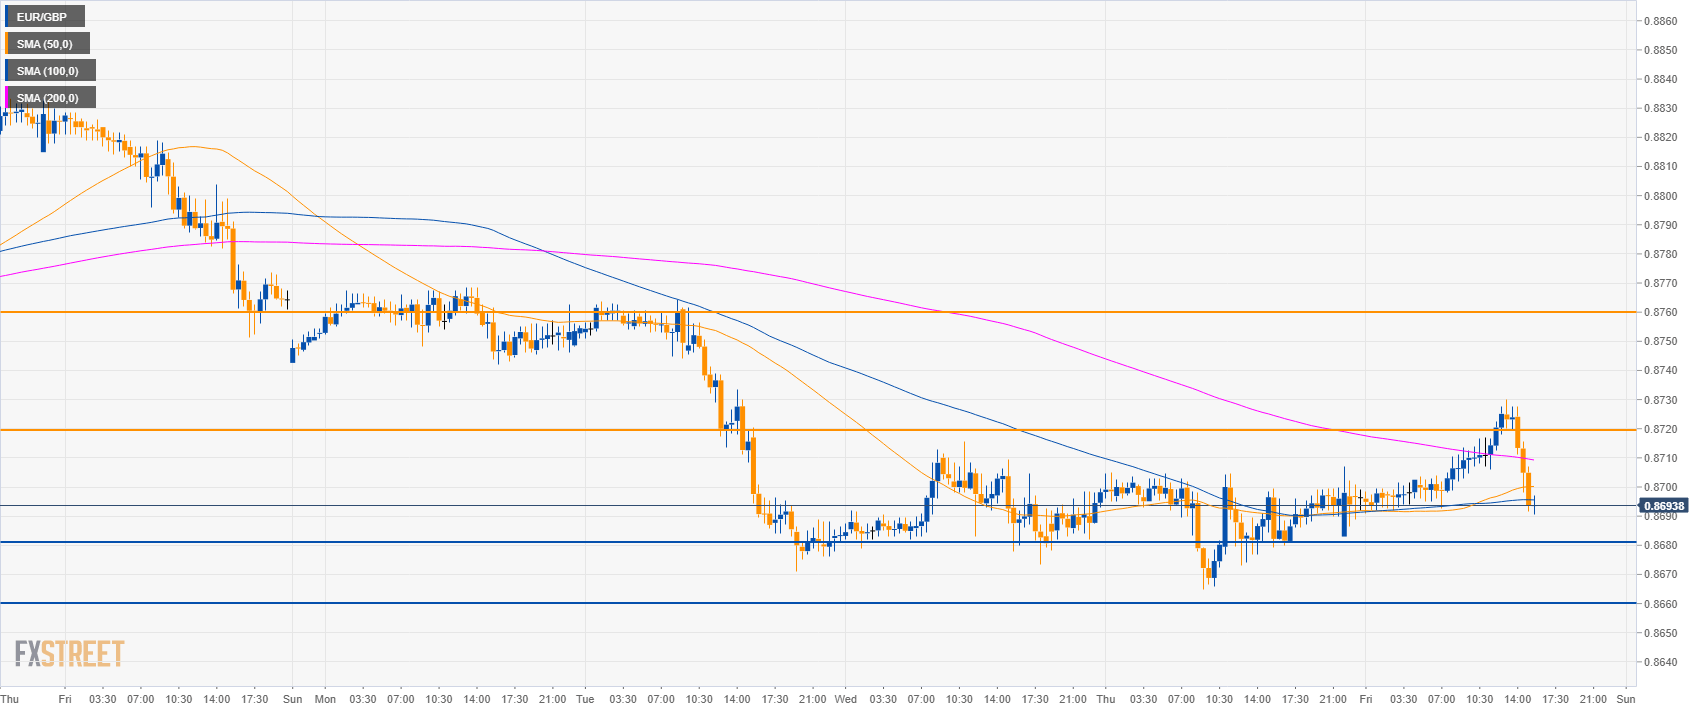
EUR/GBP 30-minute chart
- EUR/GBP is trading below the main SMAs suggesting bearish momentum in the short-term.
- EUR/GBP bears want to drive the market to 0.8680. A break below the level could lead to 0.8660 and 0.8630 level.
- To the upside, resistance is seen at 0.8720 and 0.8760 level.
Additional key levels:
EUR/GBP
Overview:
Today Last Price: 0.8694
Today Daily change: -3 pips
Today Daily change %: -0.03%
Today Daily Open: 0.8697
Trends:
Daily SMA20: 0.8746
Daily SMA50: 0.8861
Daily SMA100: 0.8851
Daily SMA200: 0.8864
Levels:
Previous Daily High: 0.8705
Previous Daily Low: 0.8665
Previous Weekly High: 0.8842
Previous Weekly Low: 0.8743
Previous Monthly High: 0.9119
Previous Monthly Low: 0.8617
Daily Fibonacci 38.2%: 0.869
Daily Fibonacci 61.8%: 0.868
Daily Pivot Point S1: 0.8673
Daily Pivot Point S2: 0.8649
Daily Pivot Point S3: 0.8633
Daily Pivot Point R1: 0.8713
Daily Pivot Point R2: 0.8729
Daily Pivot Point R3: 0.8753
