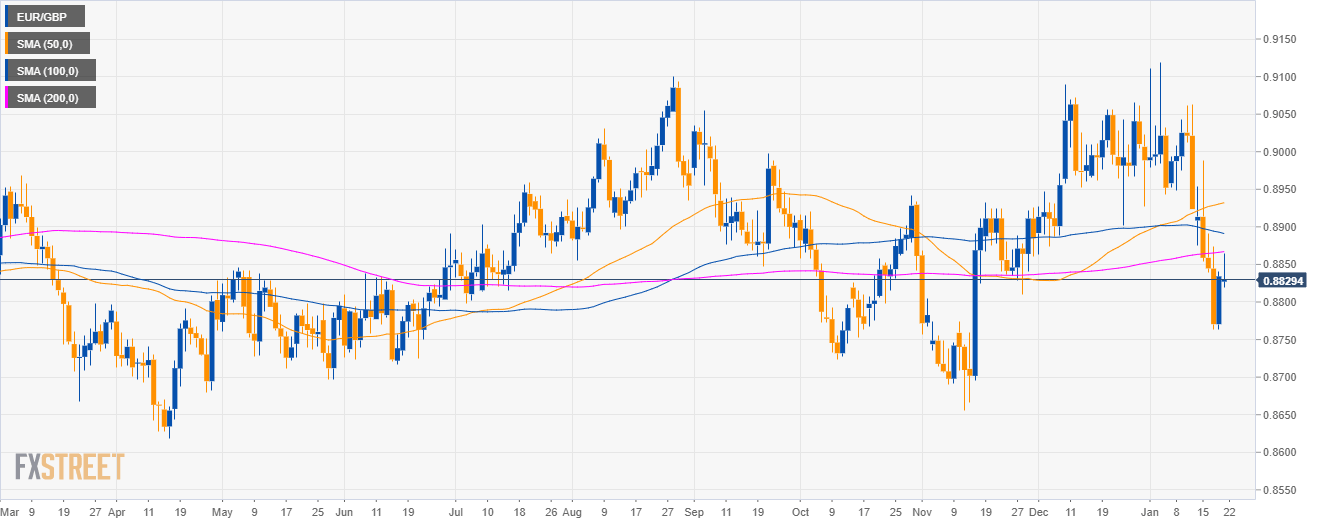
EUR/GBP daily chart
- EUR/GBP is trading in a sideways trend below the 50, 100 and 200-day simple moving averages (SMAs).
- As forecast, the 0.8840 level got hit.
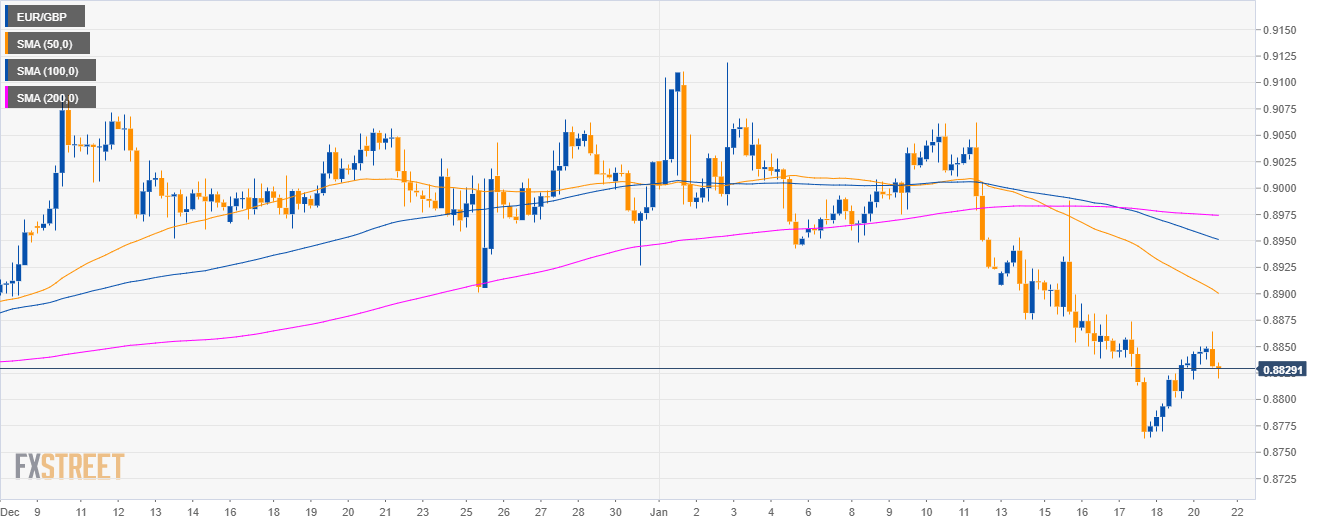
EUR/GBP 4-hour chart
- The EUR/GBP currency cross is trading below its main SMAs while bulls recaptured the 0.8800 figure.
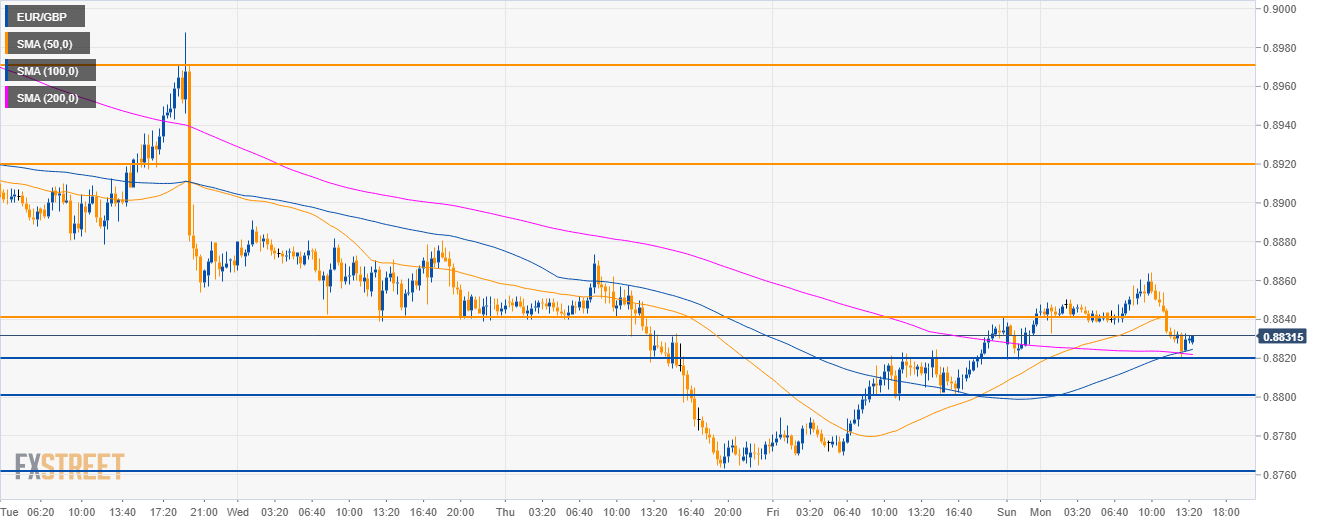
EUR/GBP 30-minute chart
- As EUR/GBP is trading above its 100 and 200 SMA, the market is set to appreciate in the coming sessions.
- The target to the upside is seen at 0.8920 and the 0.8970 level.
- To the downside, investors can expect support at 0.8800 and 0.8760.
Additional key levels
EUR/GBP
Overview:
Today Last Price: 0.883
Today Daily change: -0.0004 pips
Today Daily change %: -0.05%
Today Daily Open: 0.8834
Trends:
Daily SMA20: 0.8956
Daily SMA50: 0.893
Daily SMA100: 0.8893
Daily SMA200: 0.8865
Levels:
Previous Daily High: 0.8841
Previous Daily Low: 0.8764
Previous Weekly High: 0.8988
Previous Weekly Low: 0.8764
Previous Monthly High: 0.9089
Previous Monthly Low: 0.8863
Daily Fibonacci 38.2%: 0.8812
Daily Fibonacci 61.8%: 0.8793
Daily Pivot Point S1: 0.8785
Daily Pivot Point S2: 0.8736
Daily Pivot Point S3: 0.8708
Daily Pivot Point R1: 0.8862
Daily Pivot Point R2: 0.889
Daily Pivot Point R3: 0.8939
