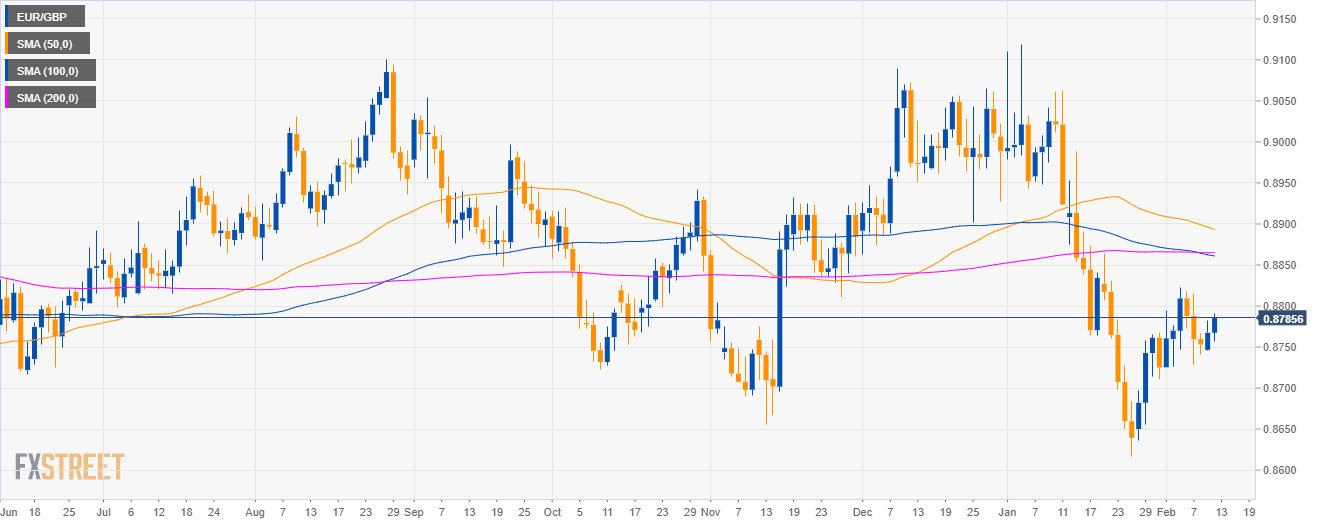
EUR/GBP daily chart
- EUR/GBP is trading in a sideways trend below the 200-day simple moving averages (SMAs).
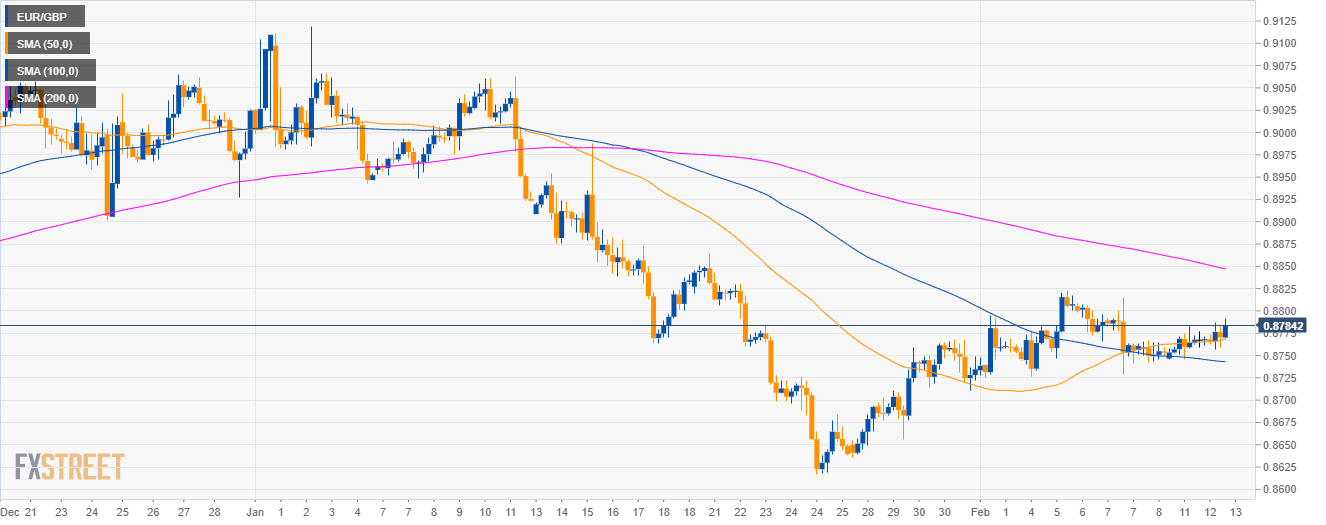
EUR/GBP 4-hour chart
- EUR/GBP is trading between the 100 and 200 SMAs on the 4-hour chart suggesting a sideways market in the medium-term.
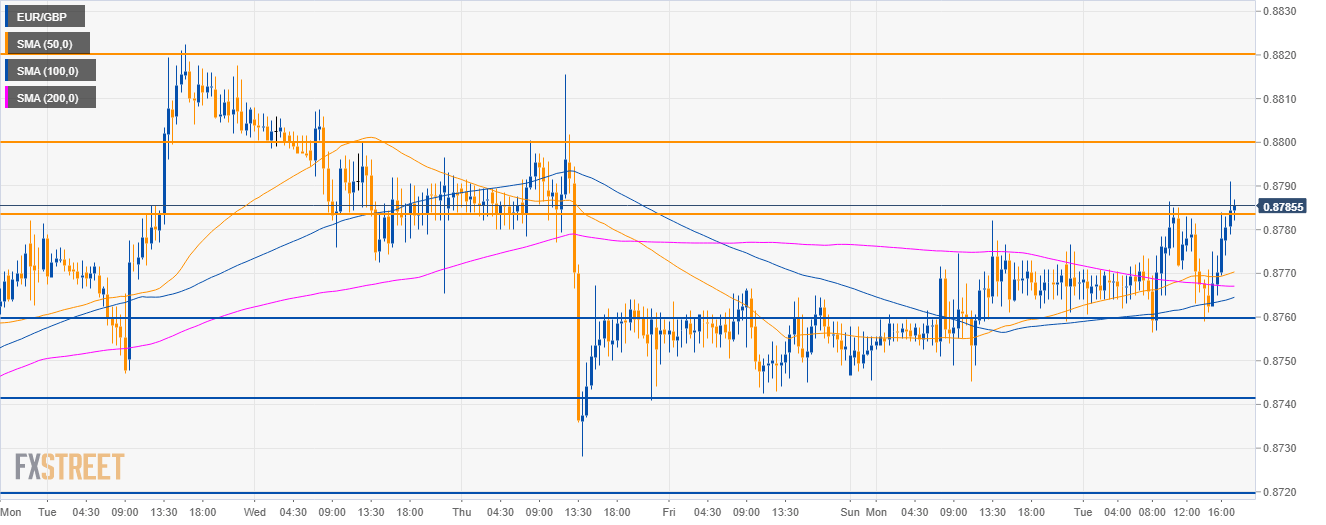
EUR/GBP 30-minute chart
- EUR/GBP is trading above its main SMAs suggesting bullish momentum in the short-term.
- A break above 0.8785 would lead to a move to 0.8800 and potentially to 0.8820 if bulls gather enough steam.
- On the flip side, if bears have a break below 0.8760, the next supports to the downside are seen near 0.8740 and 0.8720.
Additional key levels
EUR/GBP
Overview:
Today Last Price: 0.8784
Today Daily change: 17 pips
Today Daily change %: 0.19%
Today Daily Open: 0.8767
Trends:
Daily SMA20: 0.8761
Daily SMA50: 0.8896
Daily SMA100: 0.8863
Daily SMA200: 0.8865
Levels:
Previous Daily High: 0.8782
Previous Daily Low: 0.8745
Previous Weekly High: 0.8822
Previous Weekly Low: 0.8726
Previous Monthly High: 0.9119
Previous Monthly Low: 0.8617
Daily Fibonacci 38.2%: 0.8768
Daily Fibonacci 61.8%: 0.8759
Daily Pivot Point S1: 0.8748
Daily Pivot Point S2: 0.8728
Daily Pivot Point S3: 0.8711
Daily Pivot Point R1: 0.8784
Daily Pivot Point R2: 0.8802
Daily Pivot Point R3: 0.8821
