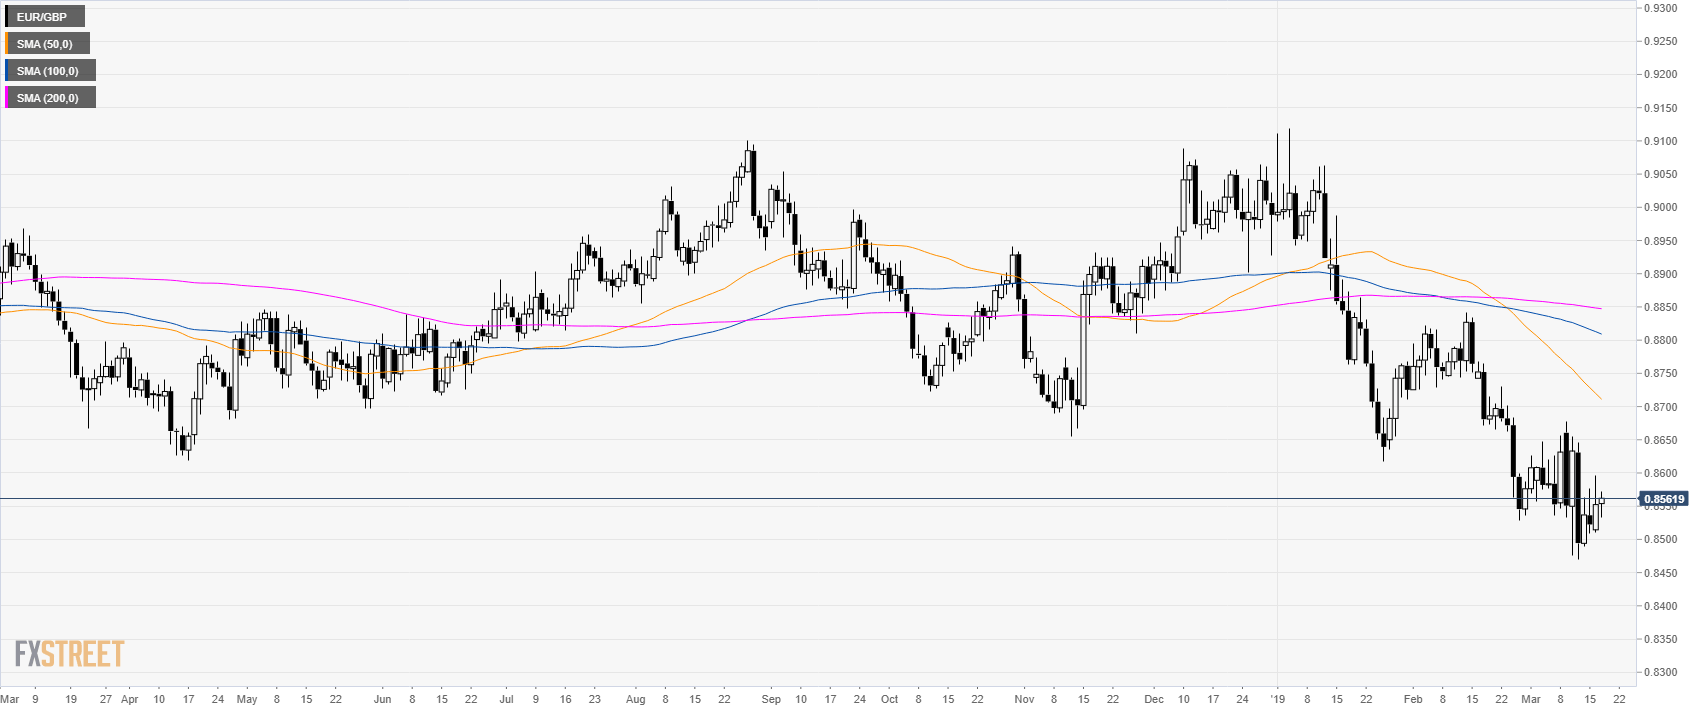
EUR/GBP daily
- EUR/GBP is trading in a sideways trend below its main simple moving averages (SMAs).
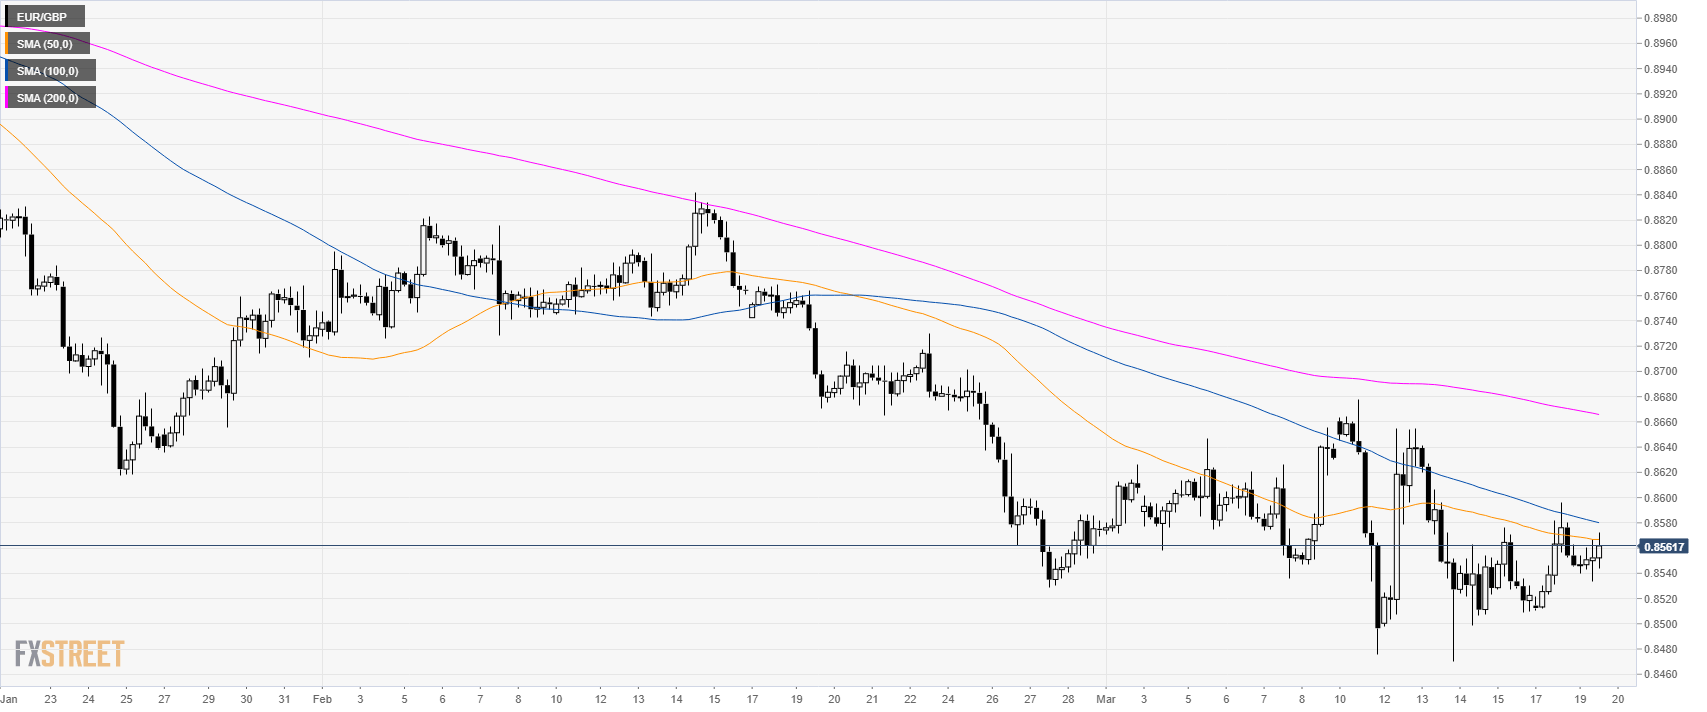
EUR/GBP 4-hour chart
- EUR/GBP is trading below the main SMAs suggesting a bearish bias in the medium-term.
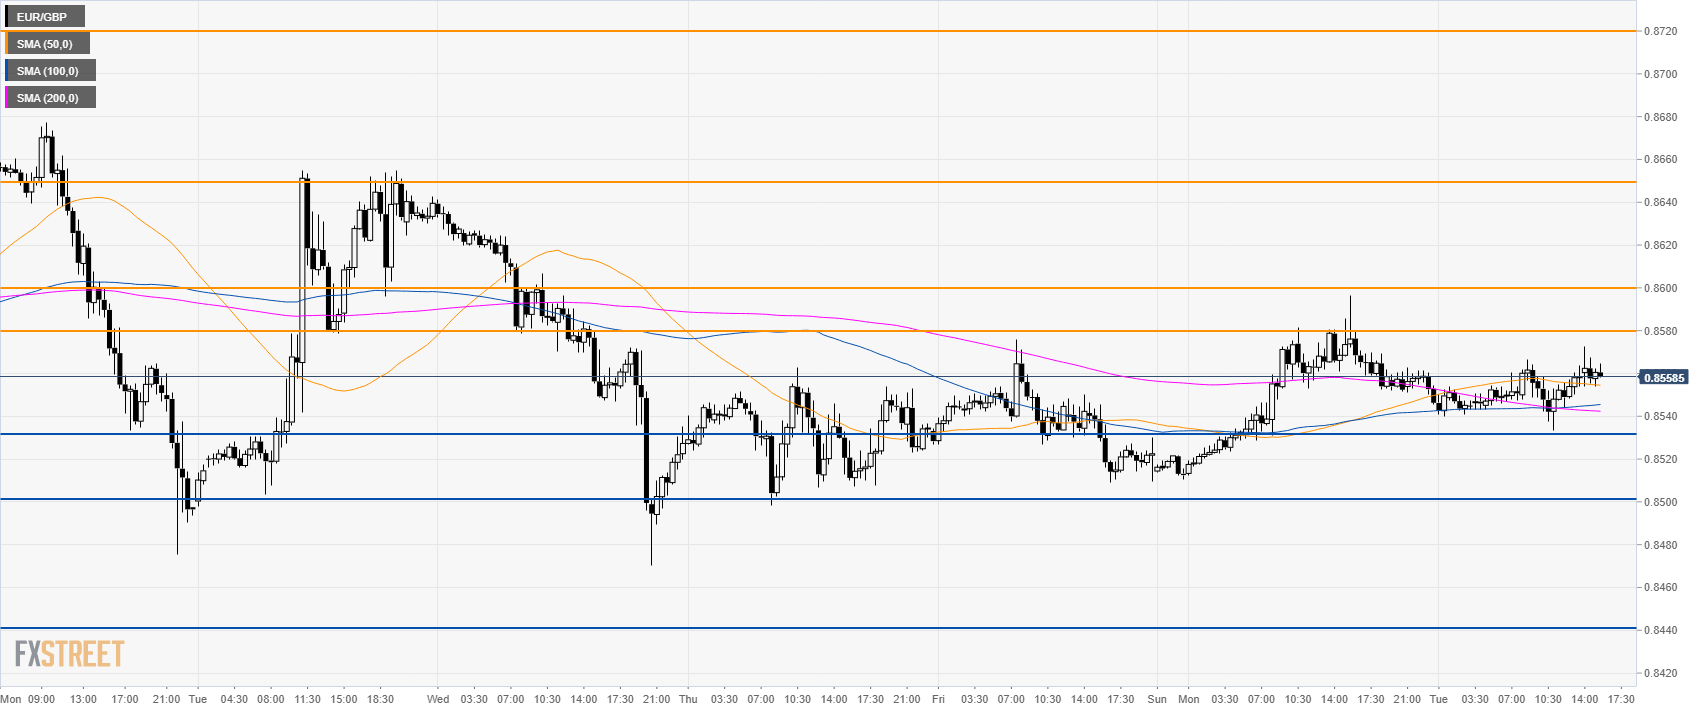
EUR/GBP 30-minute chart
- EUR/GBP is trading above its main SMAs suggesting bullish momentum in the short-term.
- A break above 0.8580 might lead to 0.8600 and 0.8650 resistances.
- Supports are seen at 0.8530, 0.8500 and 0.8440 level.
Additional key levels
EUR/GBP
Overview:
Today Last Price: 0.856
Today Daily change: 8 pips
Today Daily change %: 0.09%
Today Daily Open: 0.8552
Trends:
Daily SMA20: 0.86
Daily SMA50: 0.872
Daily SMA100: 0.8813
Daily SMA200: 0.8848
Levels:
Previous Daily High: 0.8596
Previous Daily Low: 0.851
Previous Weekly High: 0.8678
Previous Weekly Low: 0.847
Previous Monthly High: 0.8842
Previous Monthly Low: 0.8529
Daily Fibonacci 38.2%: 0.8564
Daily Fibonacci 61.8%: 0.8543
Daily Pivot Point S1: 0.851
Daily Pivot Point S2: 0.8467
Daily Pivot Point S3: 0.8424
Daily Pivot Point R1: 0.8596
Daily Pivot Point R2: 0.8639
Daily Pivot Point R3: 0.8682
