- EUR/GBP is trading the weekly lows as bears are lurking for a potential move lower.
- The key level to beat for sellers is the multi-week support at the 0.9020 level.
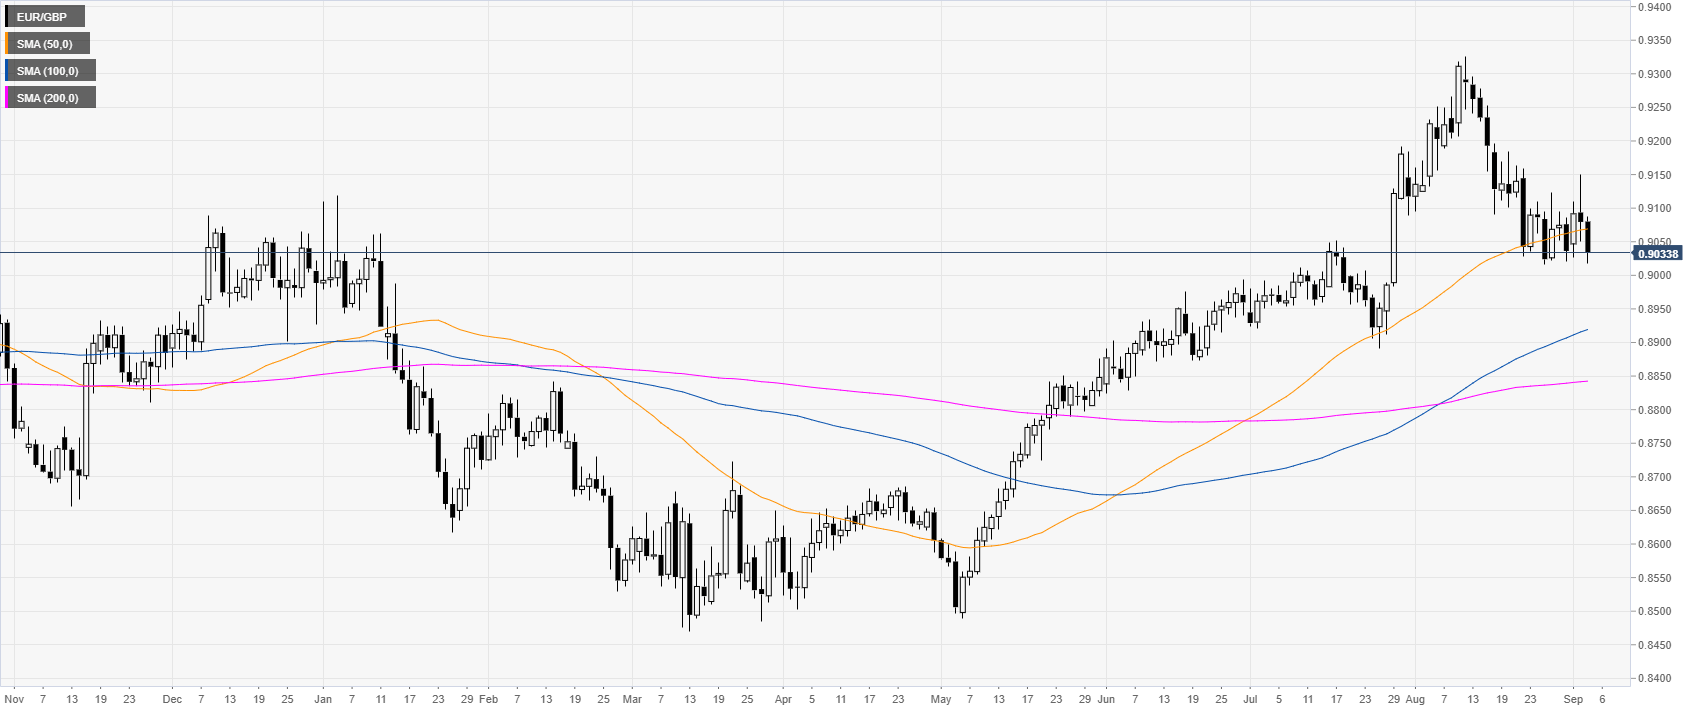
EUR/GBP daily chart
The market has been retracing down sharply in August after peaking at the 0.9326 level. EUR/GBP exchange rate is now hovering at weekly lows threatening to break a key multi-week support level at the 0.9020 level.
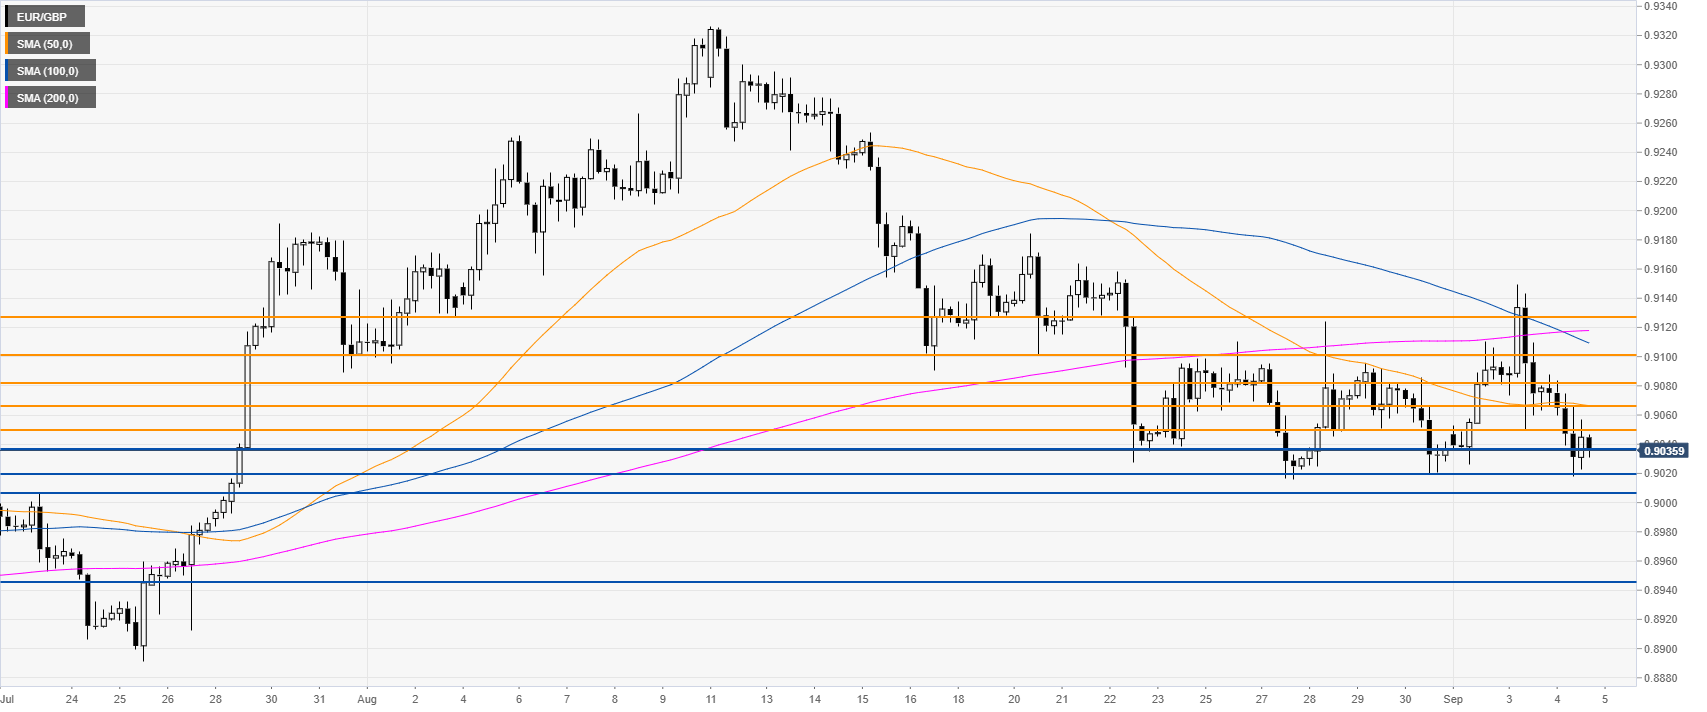
EUR/GBP 4-hour chart
EUR/GBP is trading below the main SMAs, suggesting a bearish bias in the medium term. Bears need to break the 0.9020 support to potentially reach 0.8945 on the way down, according to the Technical Confluences Indicator.
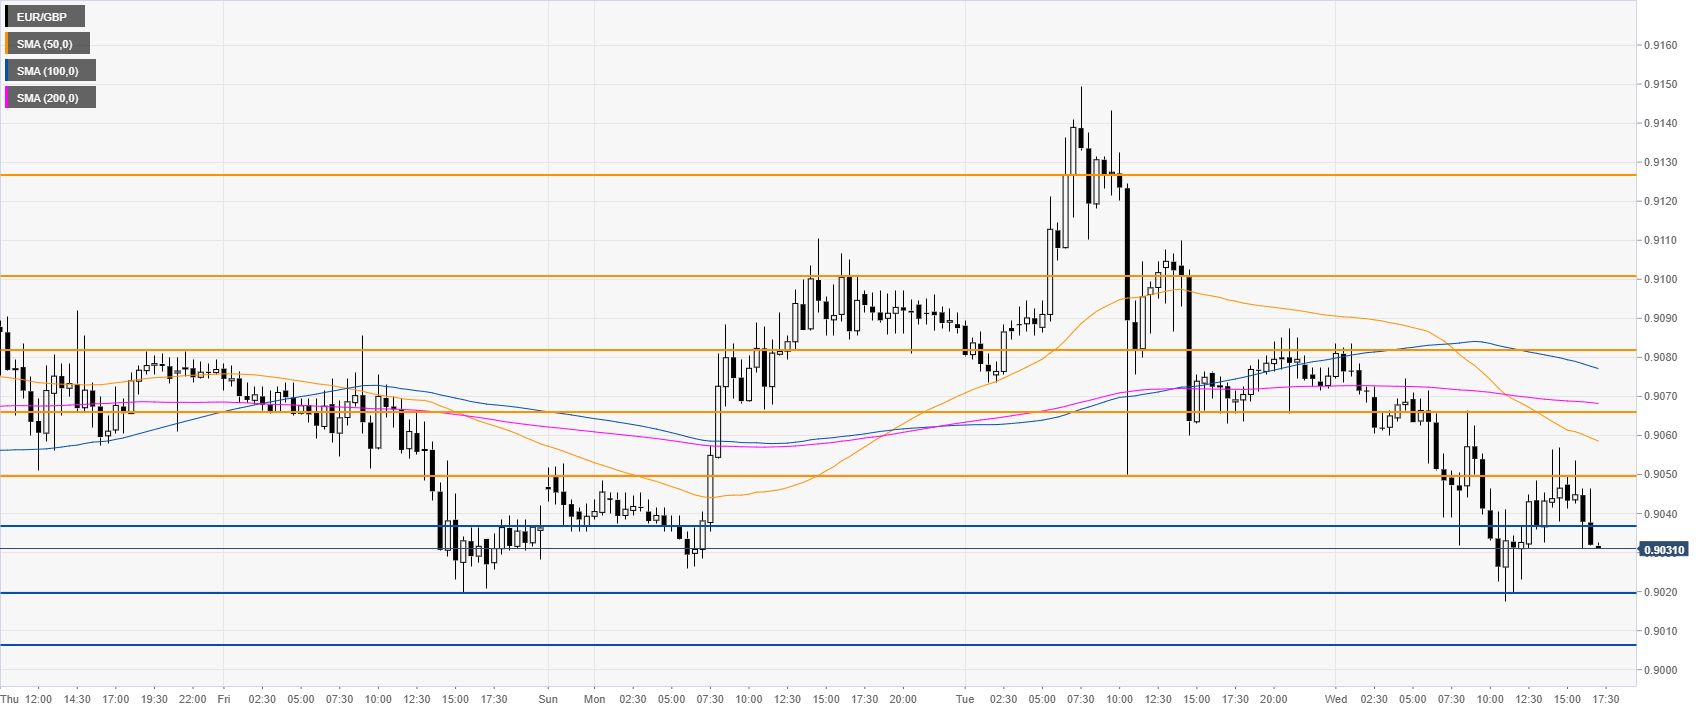
EUR/GBP 30-minute chart
EUR/GBP is under pressure below its main SMAs. Immediate resistances are seen at 0.9050, 0.9067 and 0.9081, according to the Technical Confluences Indicator.
Additional key levels


