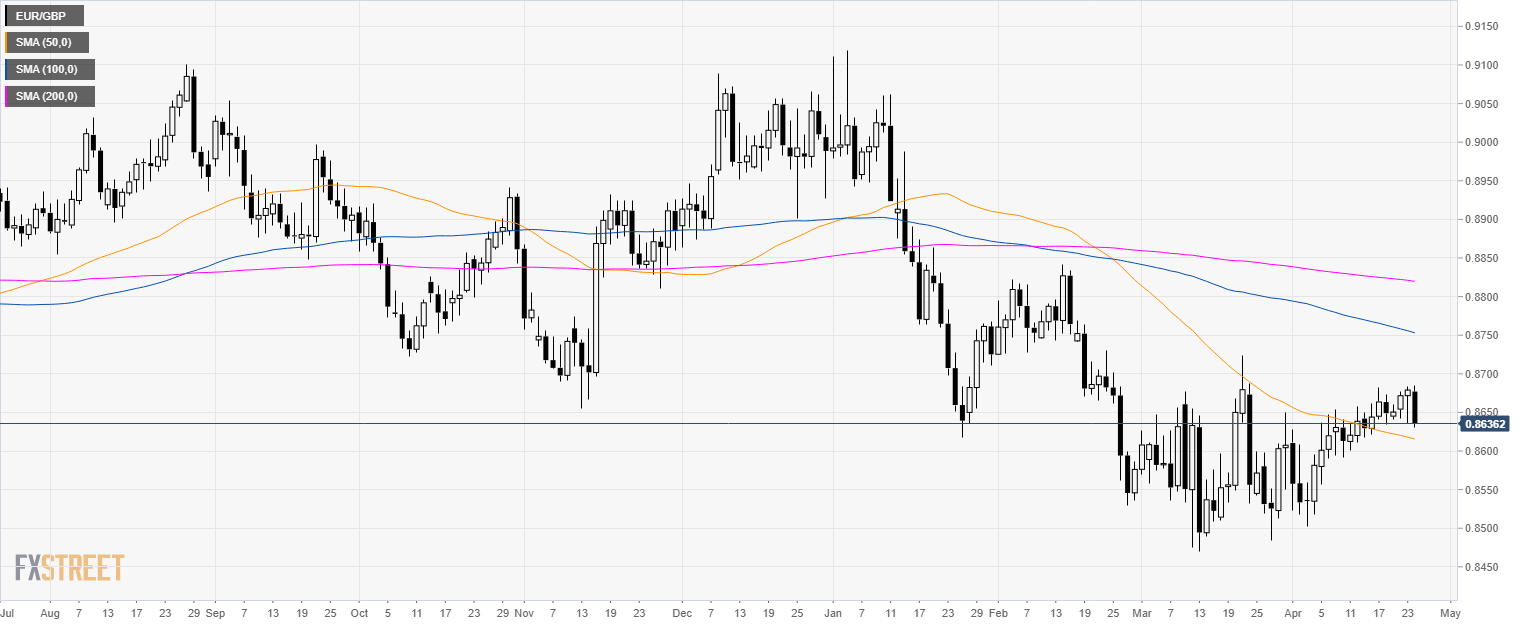
EUR/GBP daily
- EUR/GBP is trading in a bear trend below its 100 and 200 simple moving averages (SMAs).
- EUR/GBP is trading near its lowest in the last 5 days but is still trading above its 50 SMA.
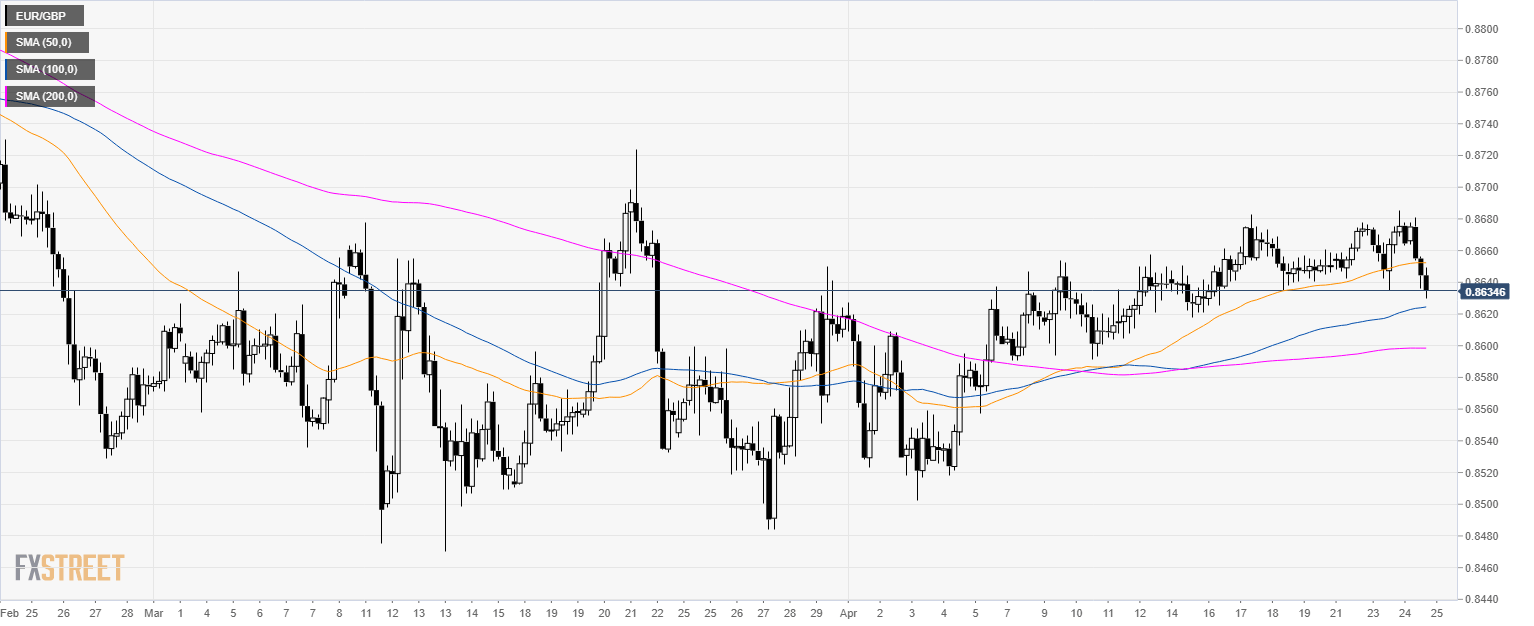
EUR/GBP 4-hour chart
- EUR/GBP is trading below its main 50 SMA suggesting a correction down in the medium-term.
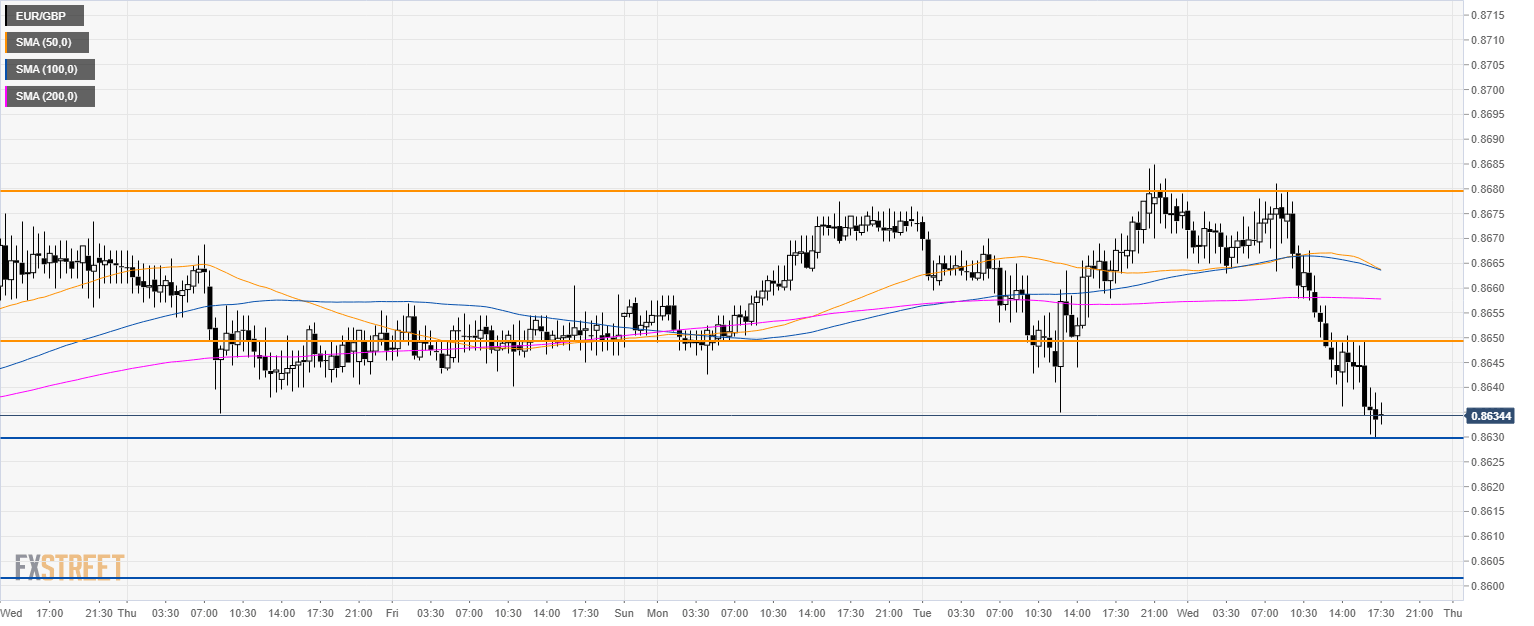
EUR/GBP 30-minute chart
- EUR/GBP is trading below its main SMAs suggesting a bearish bias in the short-term.
- 0.8630 is acting as the key support to break for bears. A breach of the level to the downside can expose the 0.8600 figure.
- Alternatively, if bulls keep the range of the last days intact, resistance is seen at 0.8650 and 0.8680 level.
Additional key levels
