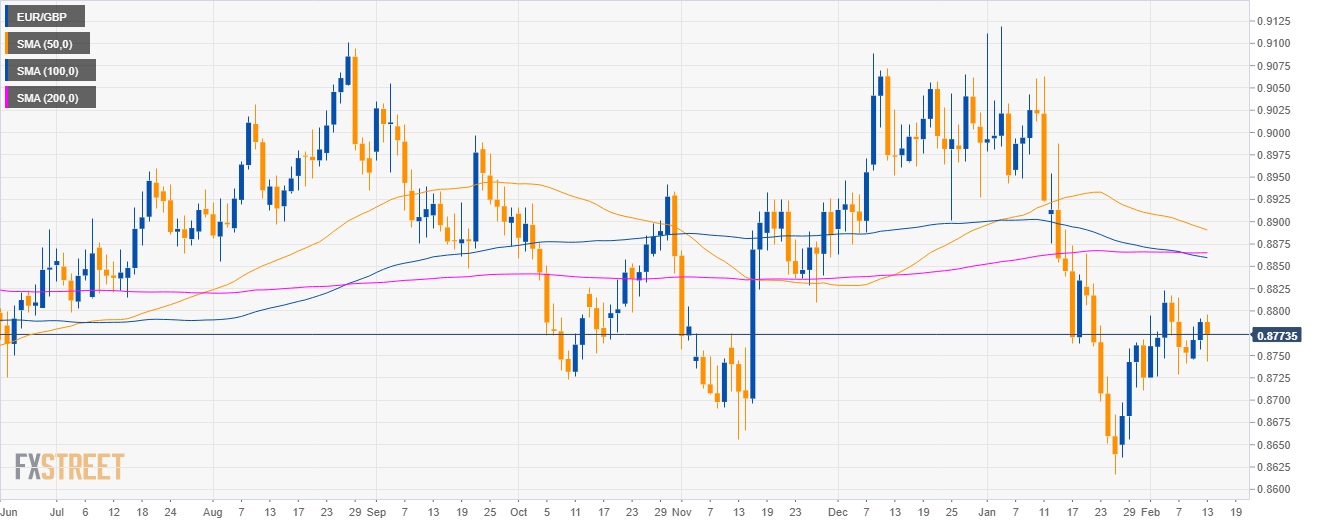
EUR/GBP daily chart
- EUR/GBP is trading in a sideways trend below the 200-day simple moving averages (SMAs).
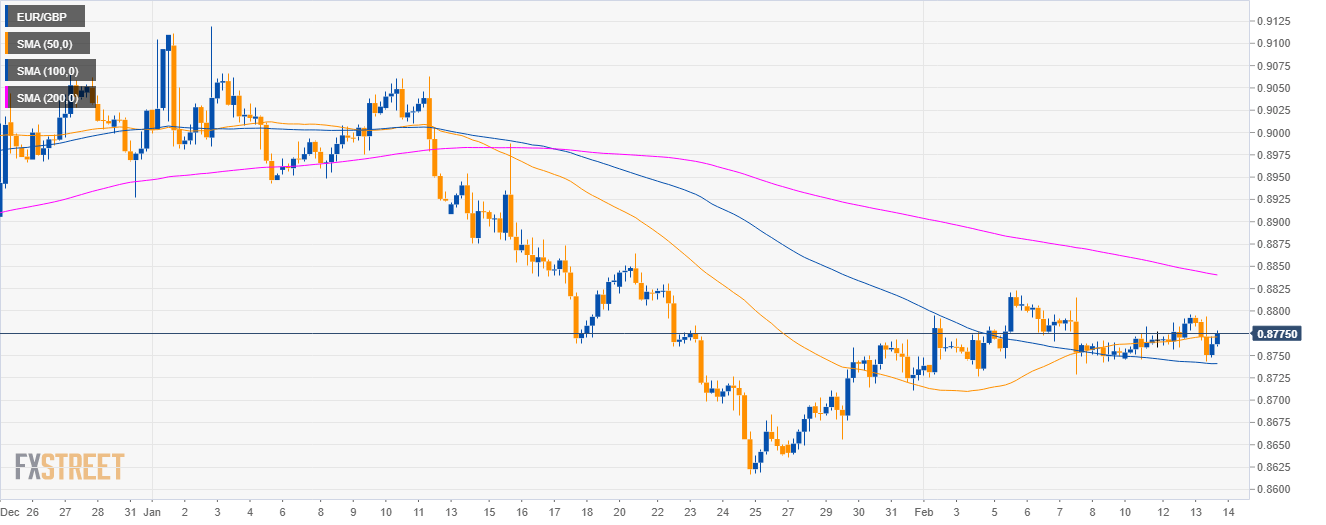
EUR/GBP4-hour chart
- EUR/GBP is trading between the 100 and 200 SMAs on the 4-hour chart suggesting a sideways market in the medium-term.
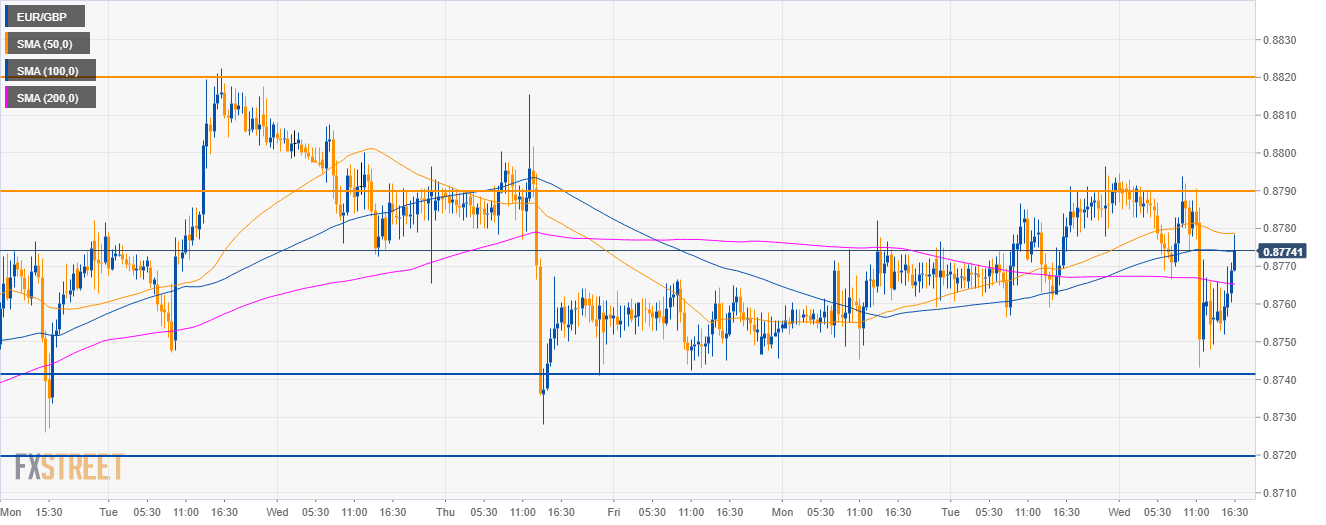
EUR/GBP 30-minute chart
- EUR/GBP is trading between the 50 and 200 SMAs on the 30-minute chart suggesting a sideways market in the short-term.
- A break above 0.8790 would lead to a move to 0.8820.
- On the flip side, if bears break below 0.8740, the next supports to the downside is seen near 0.8720 and 0.8700 figure.
Additional key levels
EUR/GBP
Overview:
Today Last Price: 0.8773
Today Daily change: -15 pips
Today Daily change %: -0.17%
Today Daily Open: 0.8788
Trends:
Daily SMA20: 0.8757
Daily SMA50: 0.8893
Daily SMA100: 0.8861
Daily SMA200: 0.8865
Levels:
Previous Daily High: 0.8791
Previous Daily Low: 0.8756
Previous Weekly High: 0.8822
Previous Weekly Low: 0.8726
Previous Monthly High: 0.9119
Previous Monthly Low: 0.8617
Daily Fibonacci 38.2%: 0.8778
Daily Fibonacci 61.8%: 0.877
Daily Pivot Point S1: 0.8766
Daily Pivot Point S2: 0.8744
Daily Pivot Point S3: 0.8731
Daily Pivot Point R1: 0.88
Daily Pivot Point R2: 0.8813
Daily Pivot Point R3: 0.8835
