- EUR/GBP is under bearish pressure trading at levels not seen since May 2019.
- The level to beat for bears is the 0.8575 support.
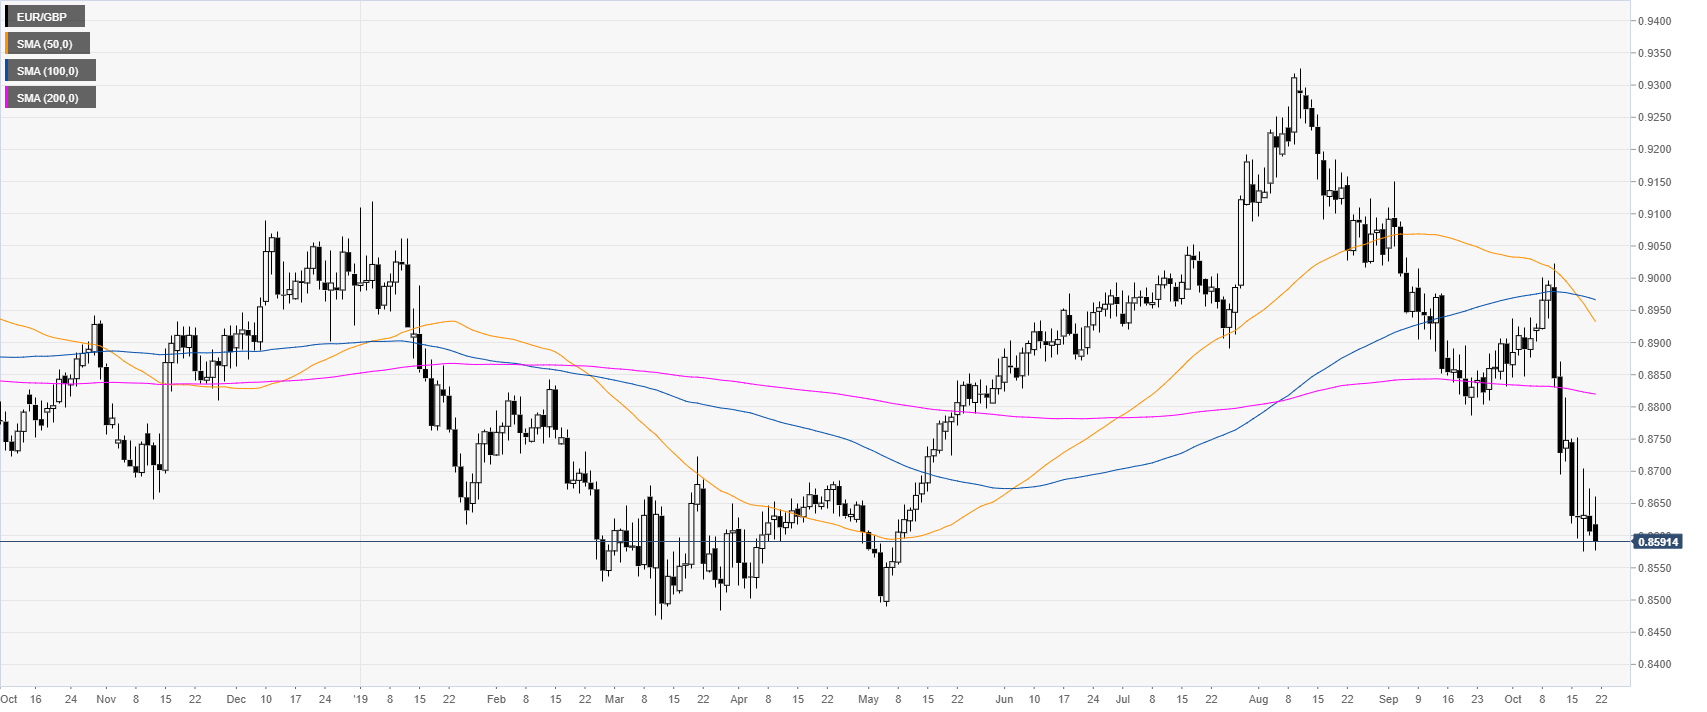
EUR/GBP daily chart
EUR/GBP, on the daily chart, is trading in a bear trend below its main daily simple moving averages (DSMAs). In the last week, the optimism of a Brexit deal sank the market below the 0.8600 handle.
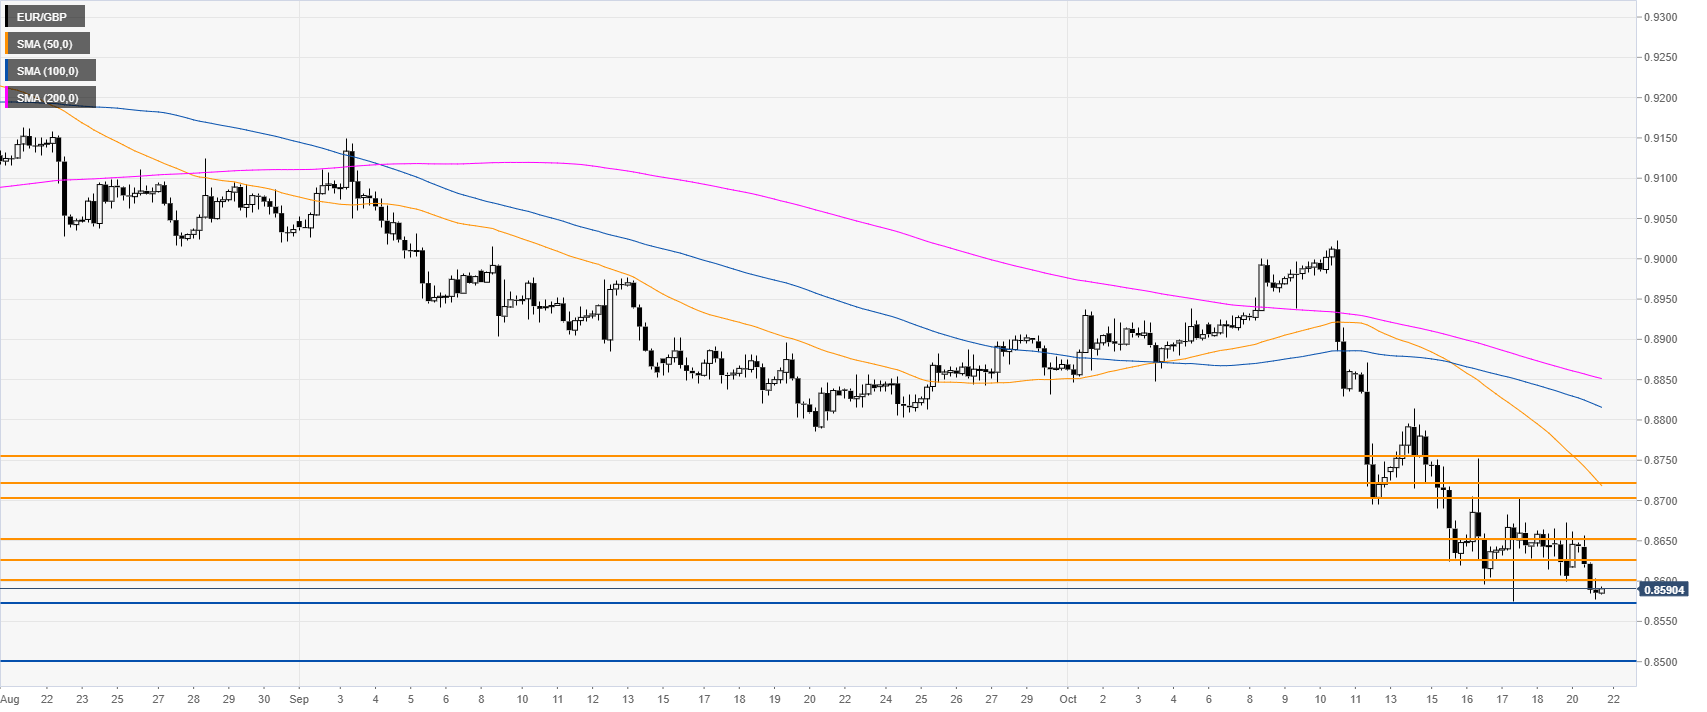
EUR/GBP four-hour chart
EUR/GBP is challenging last week lows at 0.8575 while trading below its main SMAs. A daily close below the 0.8575 support can potentially target the 0.8500 handle on the way down.
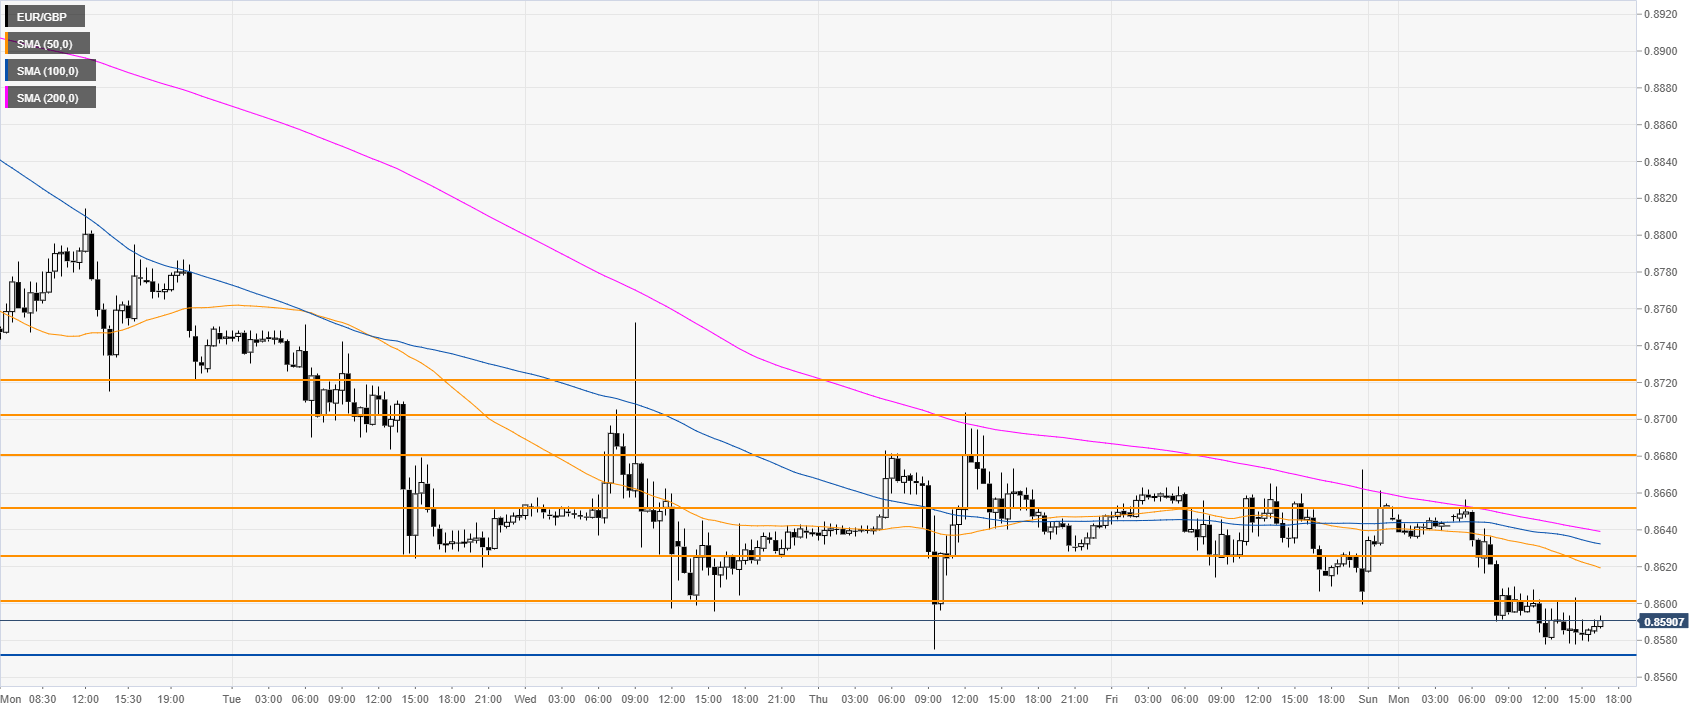
EUR/GBP 30-minute chart
EUR/GBP is trading below the main SMAs, suggesting a bearish momentum in the near term. Resistances can be seen at the 0.8600, 0.8625 and 0.8650 price levels, according to the Technical Confluences Indicator.
Additional key levels
