- EUR/GBP is under pressure after peaking at the 0.9326 level.
- The retracement down can extend towards the 0.9100 and 0.9082 supports.
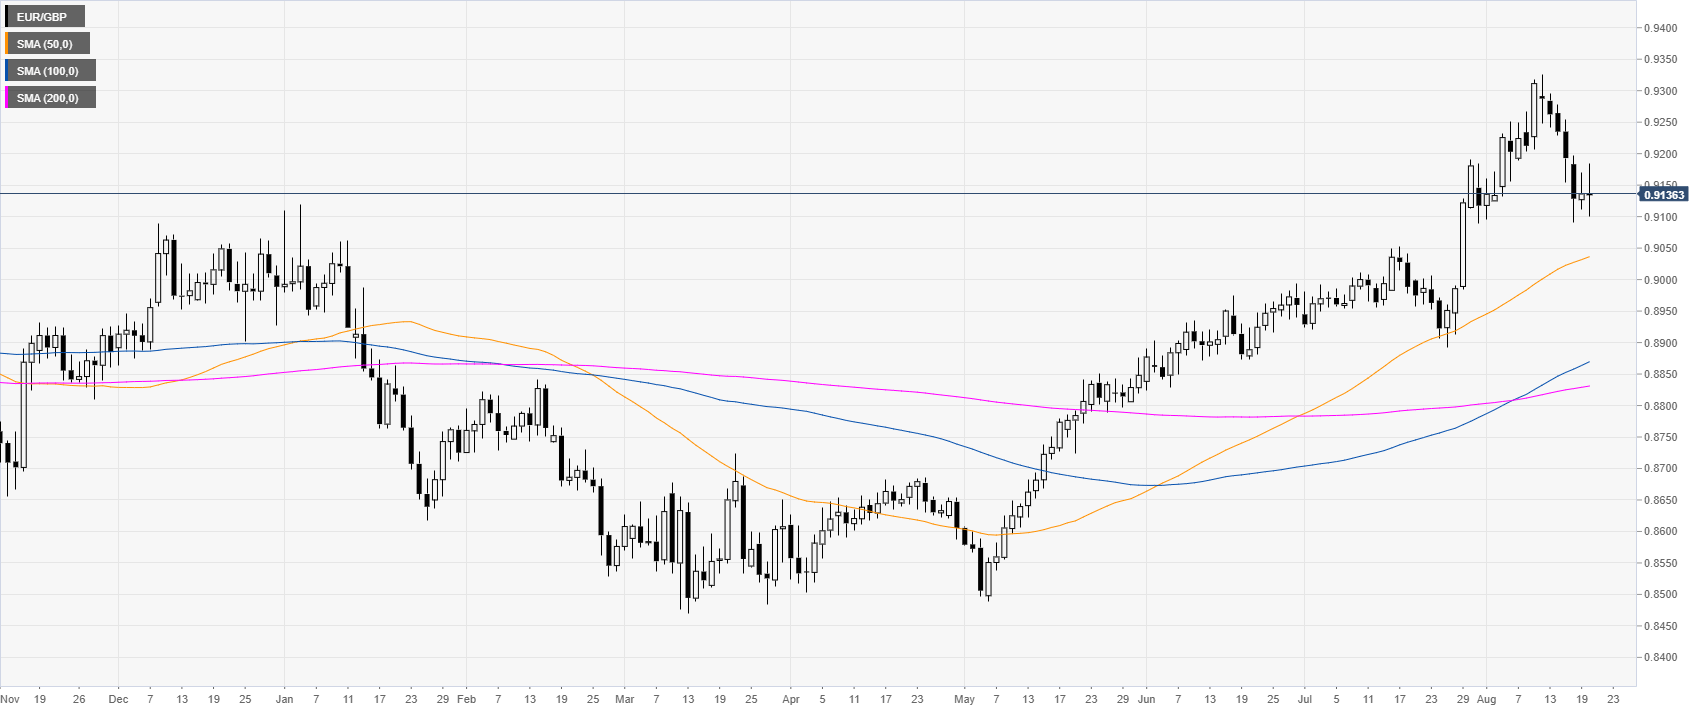
EUR/GBP daily chart
EUR/GBP is retracing down after peaking at the 0.9326 level. The market almost reached the August 29, 2017 high at the 0.9307 level.
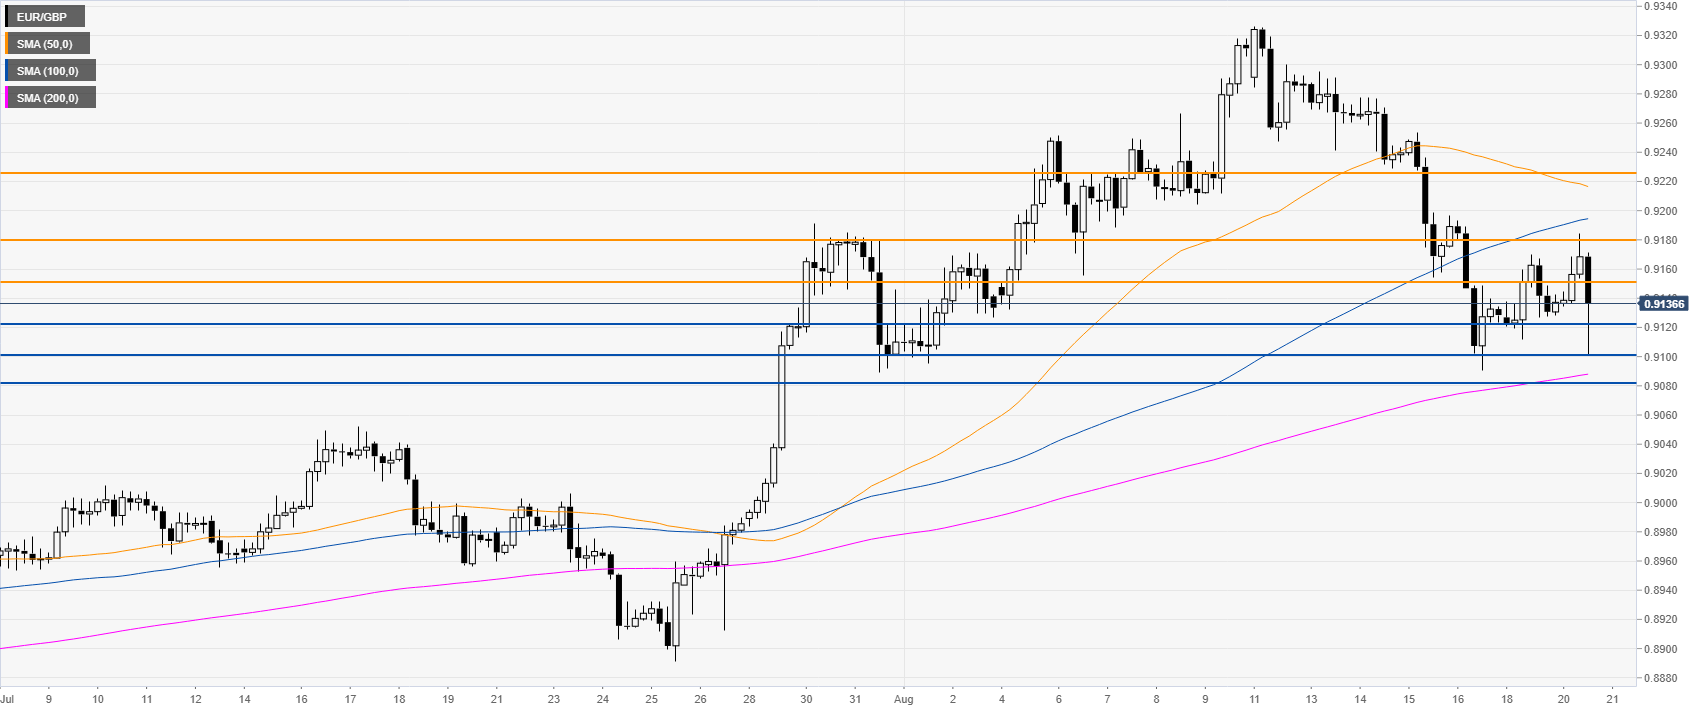
EUR/GBP 4-hour chart
EUR/GBP is losing on the backfoot below the 0.9149 resistance and the 50/100 SMAs. The market is set to decline towards 0.9100 and 0.9082, according to the Technical Confluences Indicator.
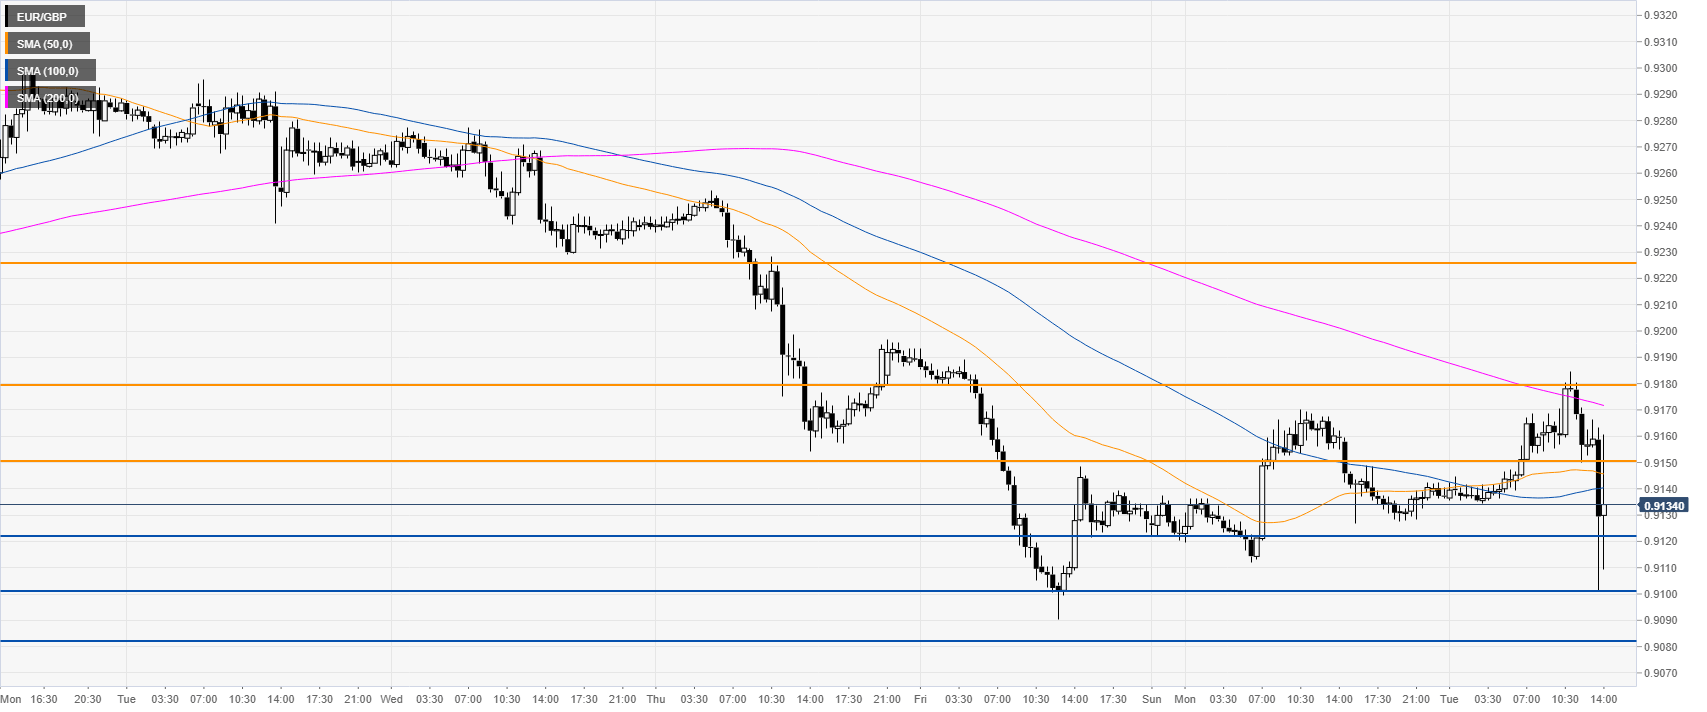
EUR/GBP 30-minute chart
EUR/GBP is under pressure below the main SMAs. Immediate resistances are seen at 0.9149, 0.9182 and 0.9230 according to the Technical Confluences Indicator.
Additional key levels
