- EUR/GBP looks set to challenge key falling trendline for the second day.
- A close above the trendline is needed to confirm an end of the sell-off from August’s high of 0.9324.
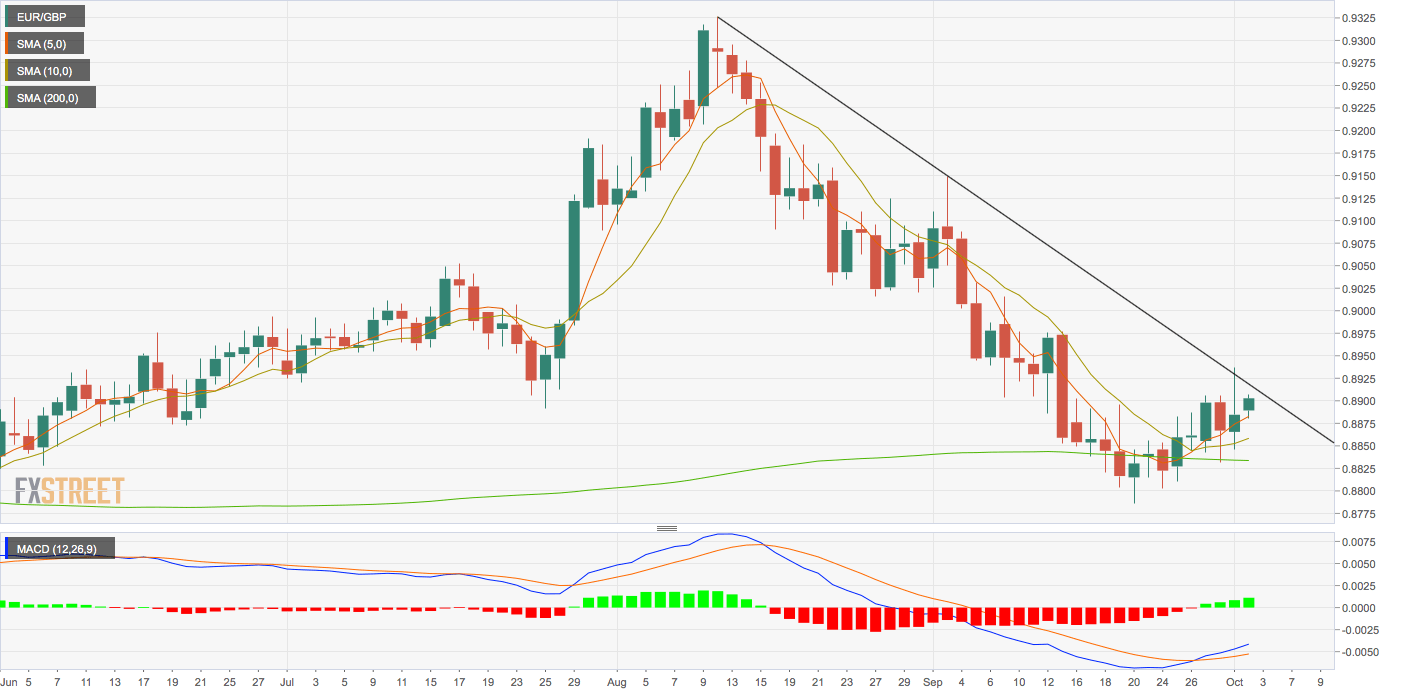
EUR/GBP is solidly bid at press time and looks set to challenge the trendline connecting Aug. 12 and Sept. 3 highs for the second consecutive day.
The currency pair is currently trading at 0.8902, representing 0.20% gains on the day.
The 5- and 10-day moving averages (MAs) are trending north, indicating a bullish bias and the MACD histogram is printing higher bars above the zero line – a sign of strengthening bullish momentum.
Hence, the pair will likely test the falling trendline resistance, currently at 0.8925. The trendline resistance was put to test on Tuesday, but the bulls failed to force a close above the key hurdle.
A daily close above the trendline resistance, if confirmed, would imply an end of the sell-off from Aug. 12’s high of 0.9324 and open the doors for a sustained rise to 0.90.
A strong rejection at the falling trendline may invite selling pressure, possibly leading to a drop to the 200-day moving average (MA), currently at 0.8831.
Daily chart
Trend: Bullish above key trendline
Technical levels
