- EUR/GBP has been skyrocketing in the last sessions.
- Can the bulls sustain the current move up or will bears take over below 0.8842 resistance? Stay tuned.
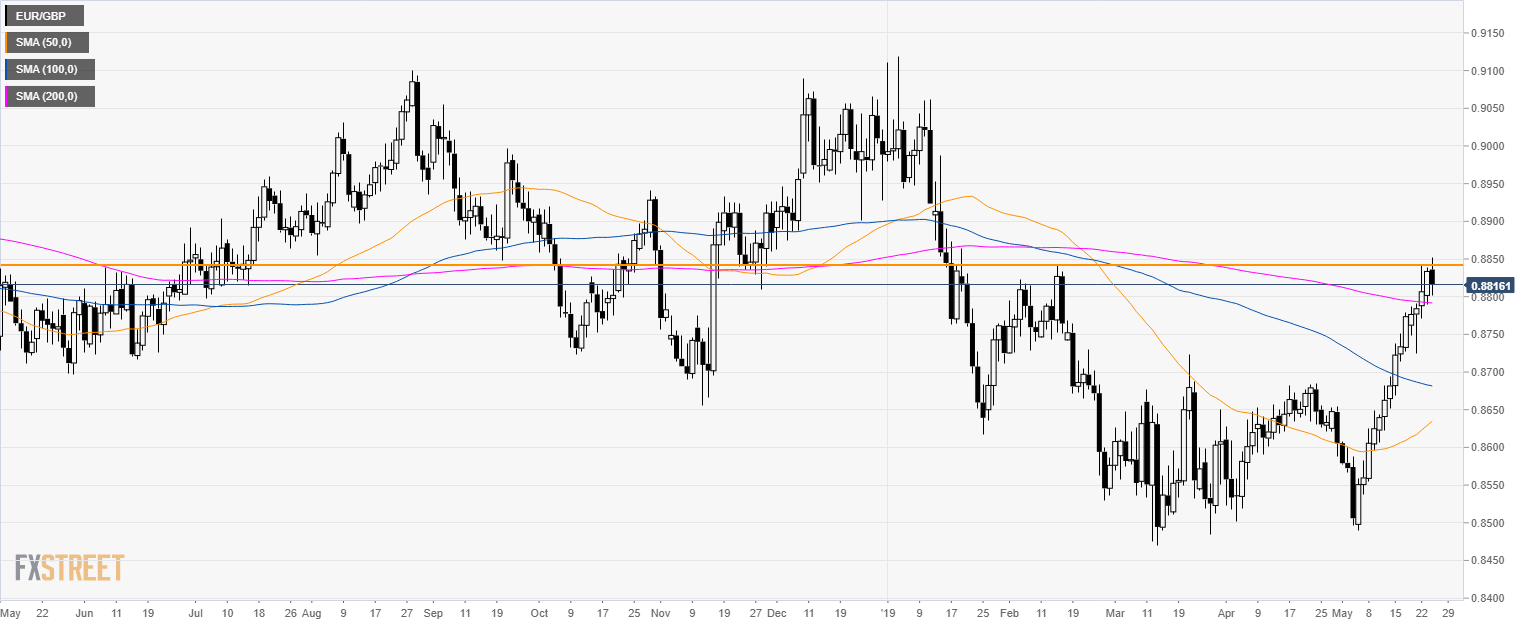
EUR/GBP daily
On the daily chart, EUR/GBP is trading in a bull testing the 0.8842 resistance.
EUR/GBP is reversing up sharply from the 2019 low. This Friday might be the first down day after 14 consecutive bullish closes.
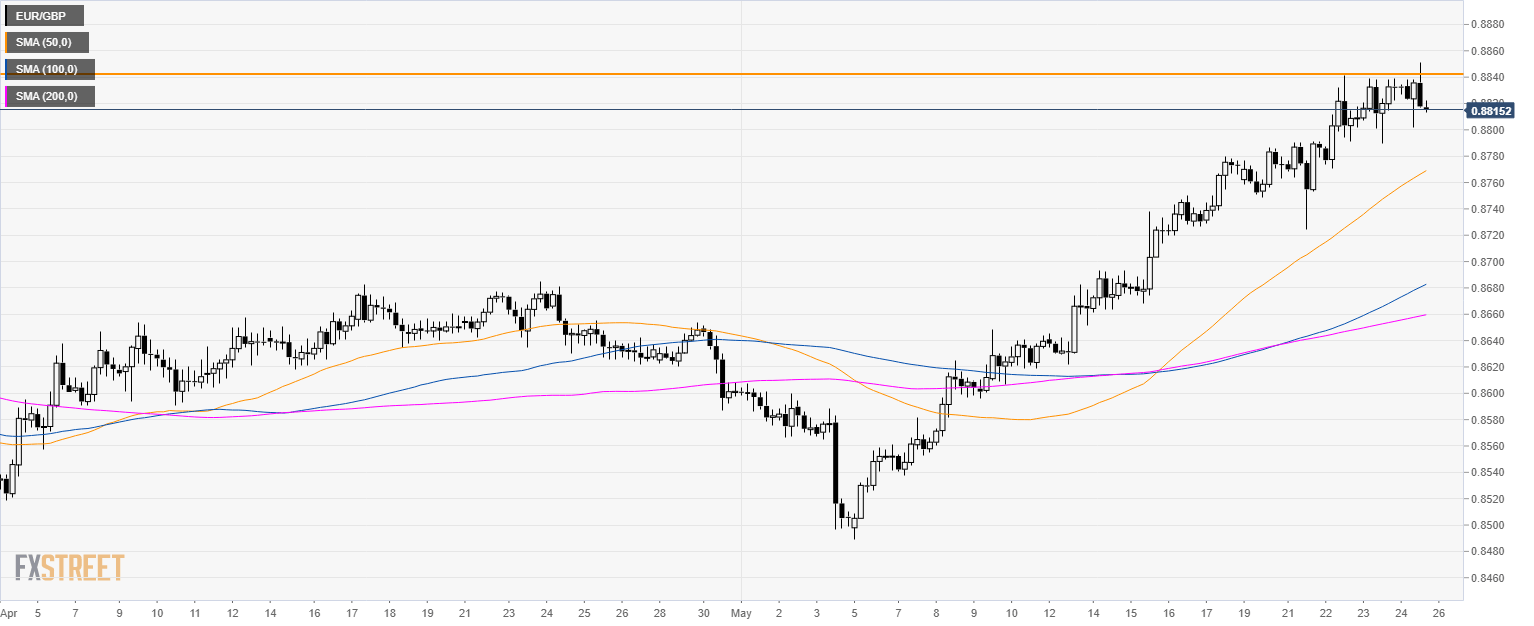
EUR/GBP 4-hour chart
EUR/GBP is trading in an ascending channel above its main SMAs suggesting bullish momentum.
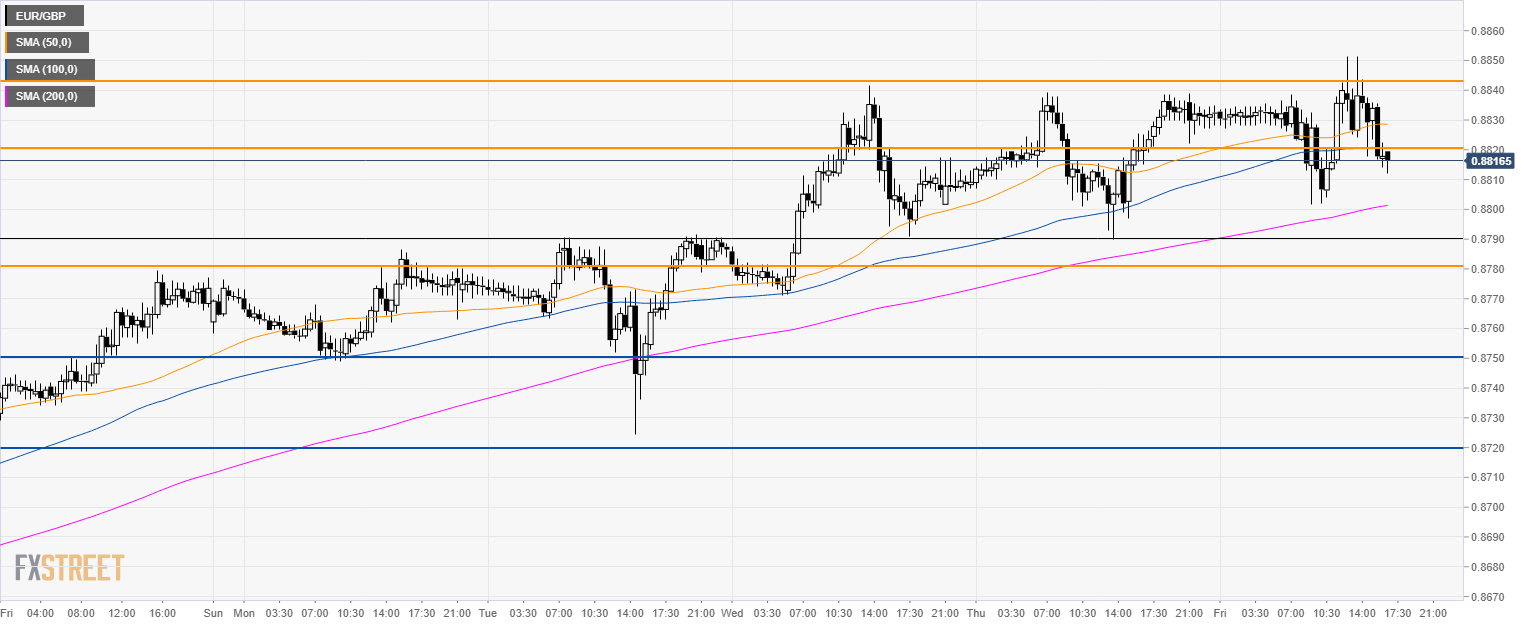
EUR/GBP 30-minute chart
EUR/GBP is still in an uptrend although the 0.8842 resistance can be a tough nut to crack. The market is trading below its 50 and 100 SMAs suggesting a potential correction down. In the absence of a break above 0.8842 the market can be seen testing 0.8780, 0.8750 and potentially 0.8720 level. If the market break beyond 0.8842 then a move up to 0.8900 figure can be on the cards.
Additional key levels
