- EUR/GBP stays below 200-hour EMA ever after it broke the key support last Thursday.
- The lower line of four-day-old falling channel limits near-term declines.
- Doji on the daily chart questions the recent weakness.
Despite recovering from early-May lows, on the back of a Doji candlestick formation, EUR/GBP still has some key resistances to justify the latest strength. The quote currently trades around 0.8657 while heading into the European market opening on Friday.
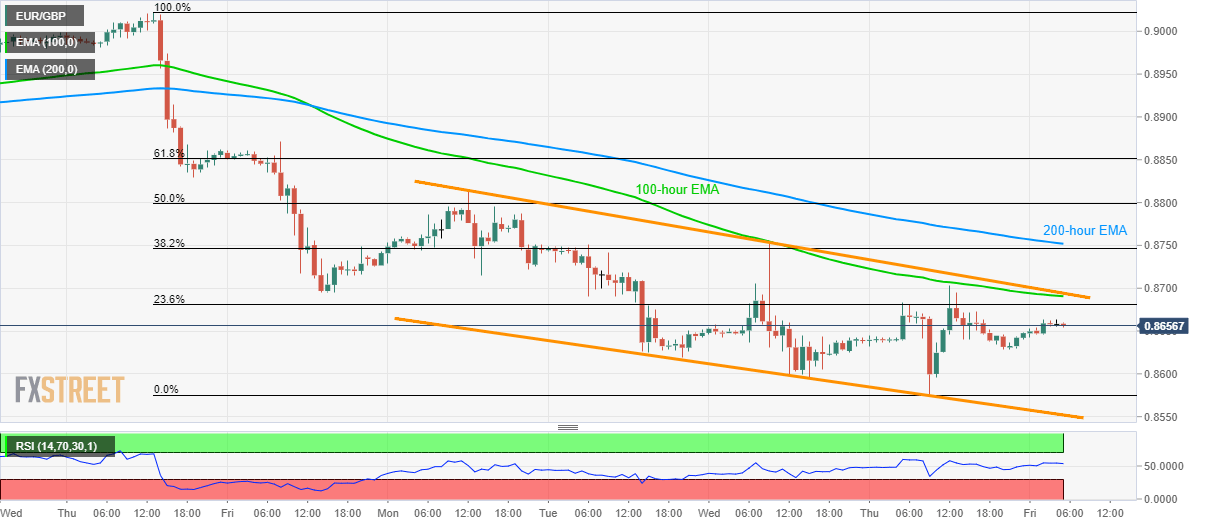
Among the resistances, the 0.8690/95 area becomes the key as it includes 100-hour Exponential Moving Average (EMA) and upper line of a short-term falling channel.
While the pair’s break of 0.8695 will enable it to question 200-hour EMA level of 0.8752, last Friday’s high nearing 0.8871 could challenge buyers afterward.
Meanwhile, 0.8630 and the recent low of 0.8575 can entertain sellers ahead of questioning the downpour with the channel’s lower line, at 0.8550 now.
EUR/GBP hourly chart
Trend: bearish
