- EUR/GBP is above the 0.8832/40 (21-D SMA) bearish triangle support and making bullish advances.
- The 0.9034 October 2017 high on the wide is a key upside.
EUR/GBP daily chart, price above bearish triangle resistance
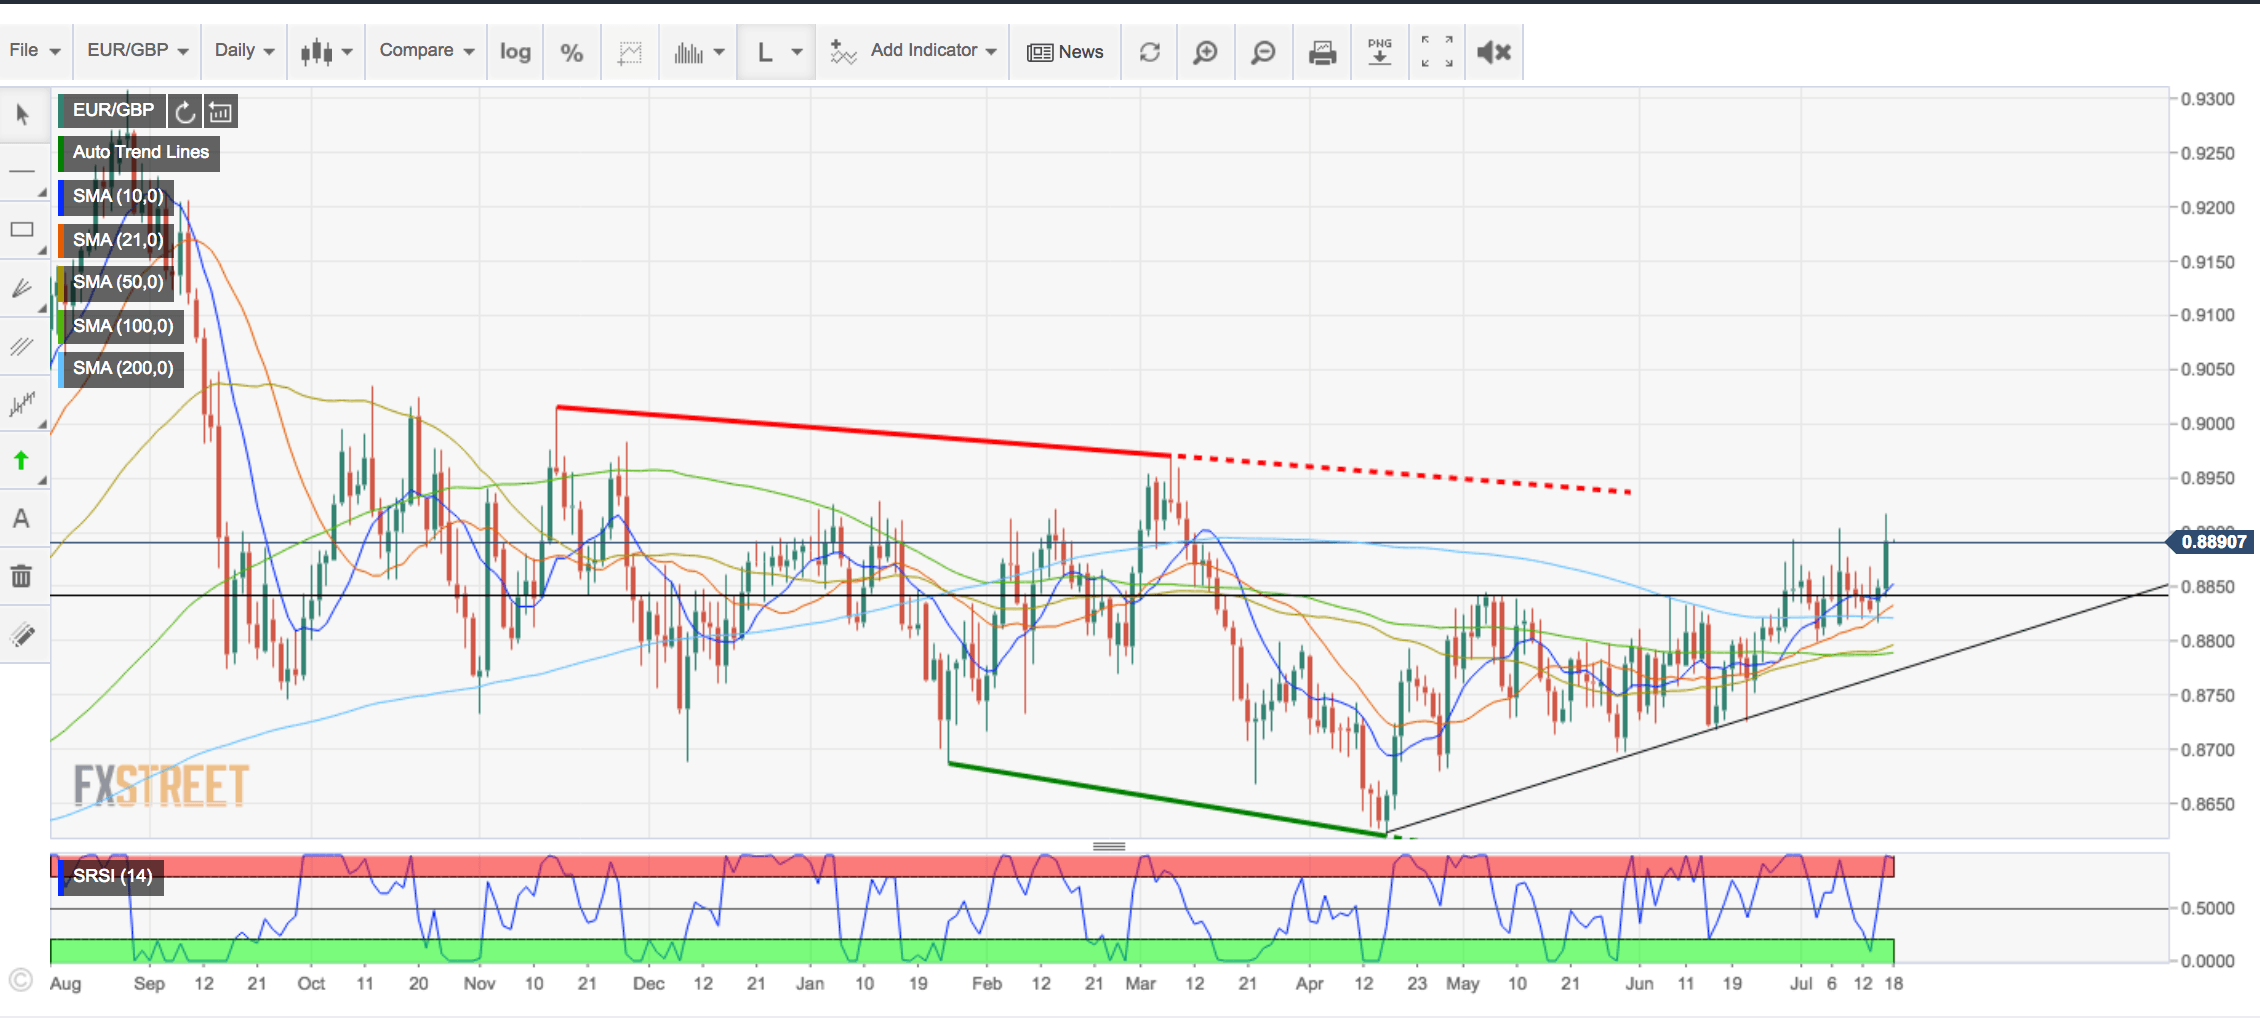
Spot rate: 0.8890
High: 0.8914
Low: 0.8888
Trend: Bullish
Resistance 1: 0.8920
Resistance 2: 0.8943 (5th May tops).
Resistance 3: The 0.9034 October 2017 high on the wide is a key upside.
Support 1: 0.8852 (10-D SMA)
Support 2: 0.8832/40 (21-D SMA) bearish triangle support
Support 3: 0.8620 protects a run towards 0.8526 as being the 78.6% retracement of the move from 2017 on the wide.
