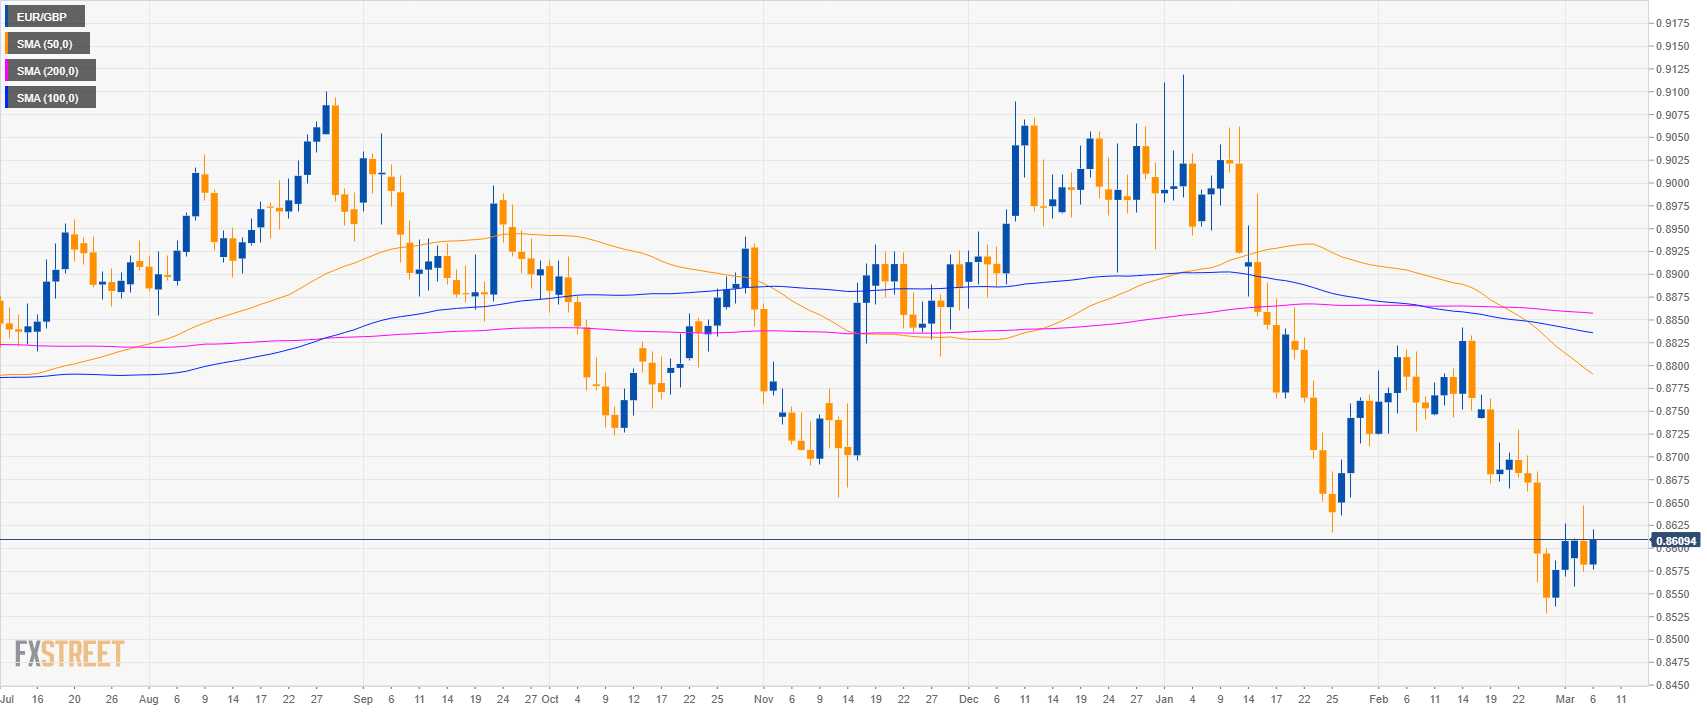
EUR/GBP daily chart
- EUR/GBP is trading in a sideways trend below its main simple moving averages (SMAs).
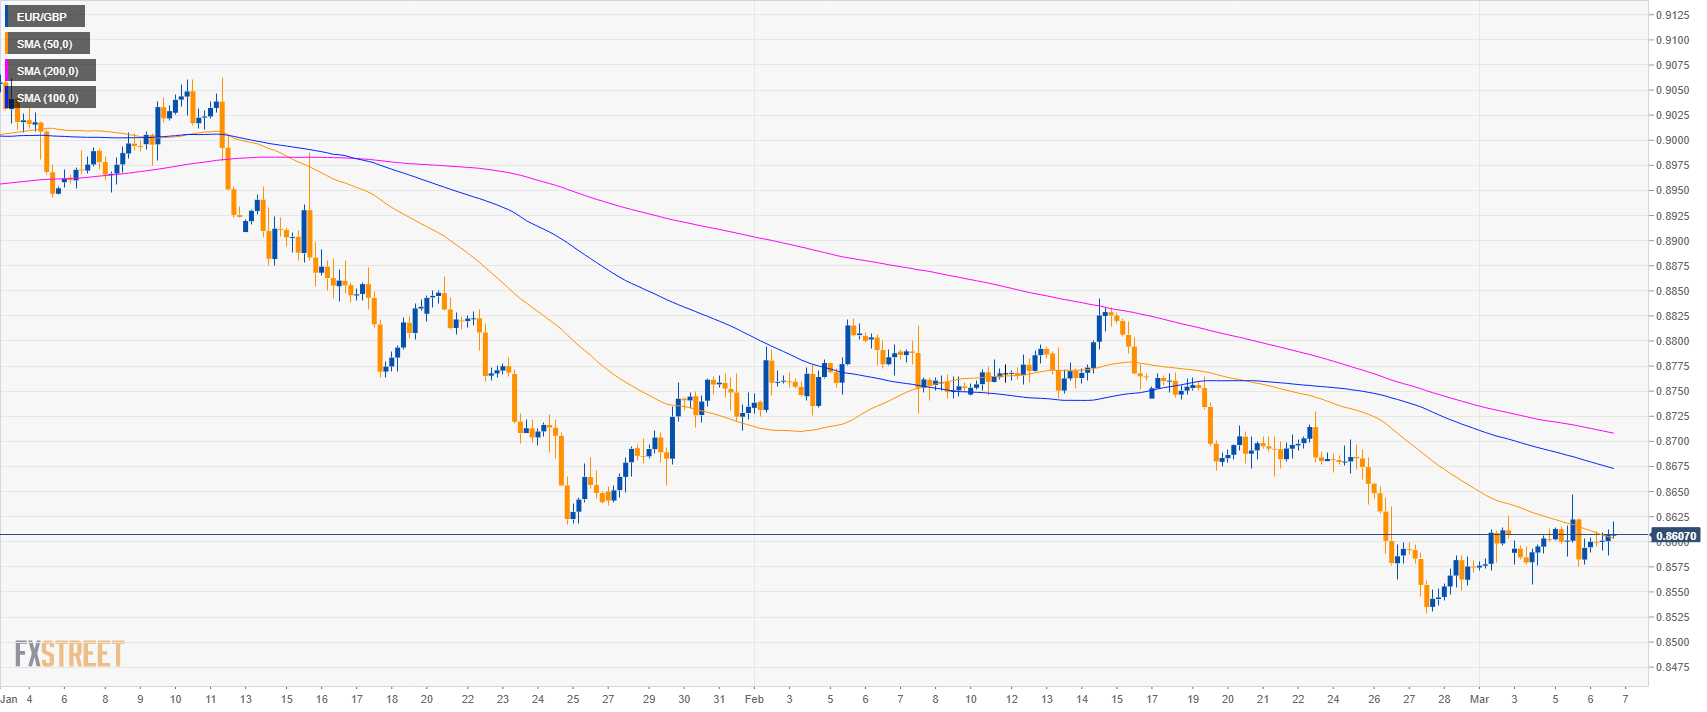
EUR/GBP 4-hour chart
- EUR/GBP is trading between the 50 and 100 SMAs suggesting a consolidation phase in the medium-term.
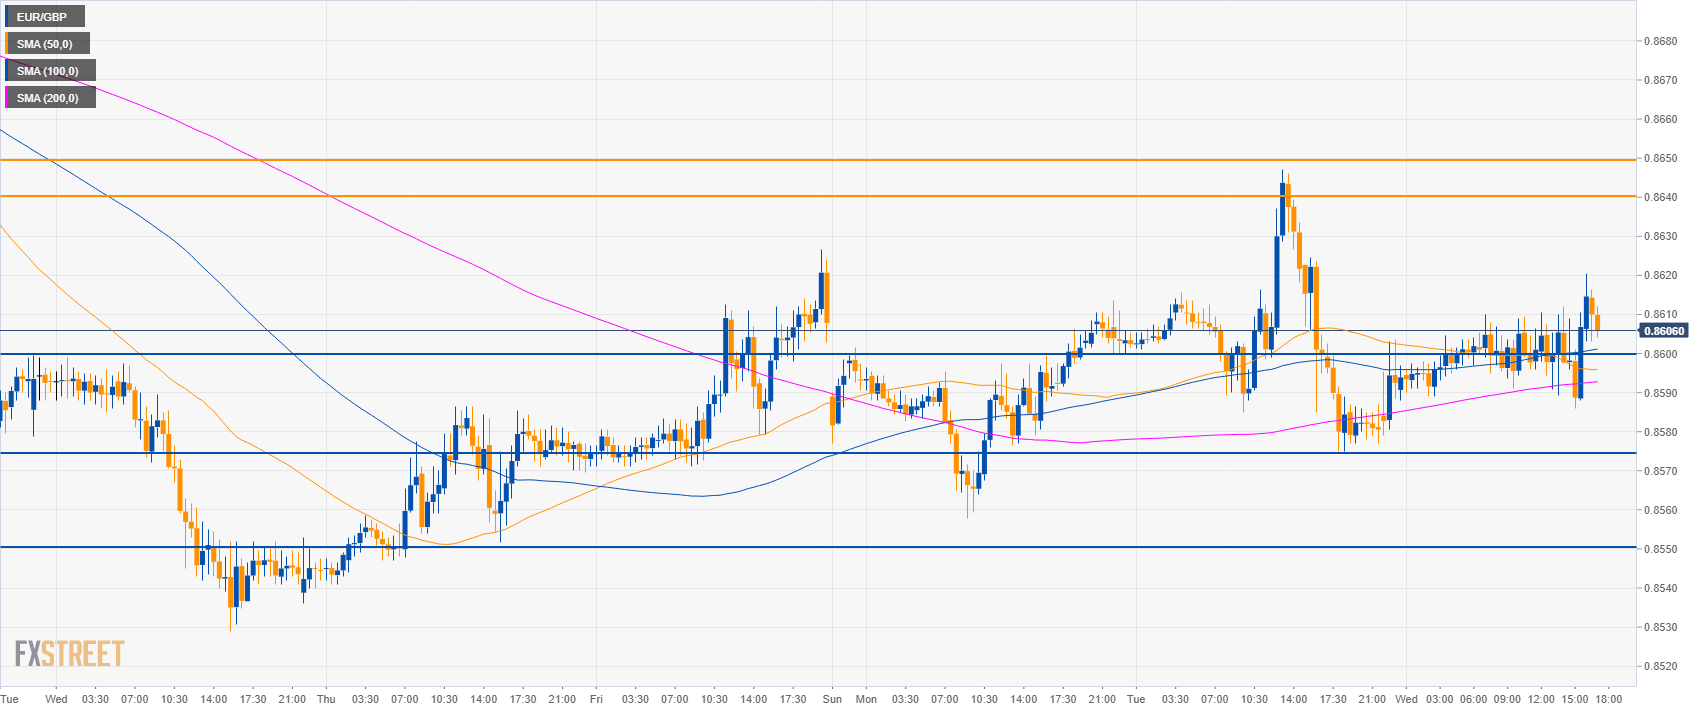
EUR/GBP 30-minute chart
- EUR/GBP is having a slow bullish grind above its main SMAs.
- Short-term bulls objectives are at 0.8640 and 0.8650 level.
- To the downside, support is at 0.8575 and 0.8555 level.
Additional key levels
EUR/GBP
Overview:
Today Last Price: 0.8607
Today Daily change: 25 pips
Today Daily change %: 0.29%
Today Daily Open: 0.8582
Trends:
Daily SMA20: 0.8695
Daily SMA50: 0.8798
Daily SMA100: 0.8838
Daily SMA200: 0.8858
Levels:
Previous Daily High: 0.8647
Previous Daily Low: 0.8575
Previous Weekly High: 0.8702
Previous Weekly Low: 0.8529
Previous Monthly High: 0.8842
Previous Monthly Low: 0.8529
Daily Fibonacci 38.2%: 0.8603
Daily Fibonacci 61.8%: 0.8619
Daily Pivot Point S1: 0.8556
Daily Pivot Point S2: 0.8529
Daily Pivot Point S3: 0.8484
Daily Pivot Point R1: 0.8628
Daily Pivot Point R2: 0.8673
Daily Pivot Point R3: 0.87
