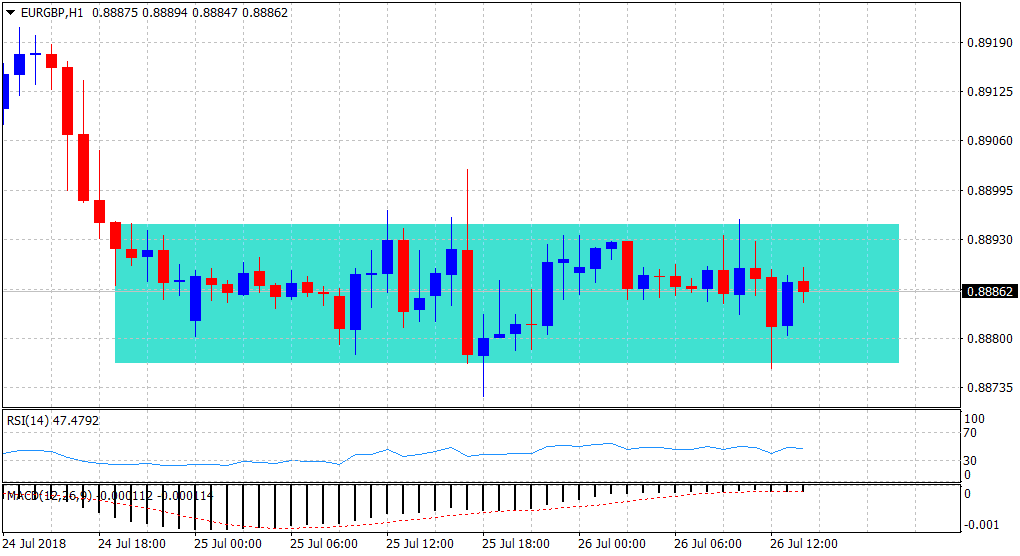
“¢ Barring some knee-jerk spikes in either direction, the cross has been largely confined within a narrow trading range over the past 48-hours or so.
“¢ The range-bound price action now seems to constitute towards the formation of a rectangular chart pattern on the 1-hourly chart, indicating a consolidation phase before the next leg of directional move.
“¢ Neutral technical indicators have done little to determine the near-term direction and hence, it would be prudent to wait for a decisive breakout before committing to the pair’s near-term trajectory.
Spot rate: 0.8886
Daily High: 0.8896
Daily Low: 0.8876
Trend: Sideways
Resistance
R1: 0.8900 (200-period SMA H1)
R2: 0.8921 (R2 daily pivot-point)
R3: 0.8958 (over 4-month tops set last Friday)
Support
S1: 0.8872 (overnight swing low)
S2: 0.8858 (S2 daily pivot-point)
S3: 0.8822 (200-day SMA)
