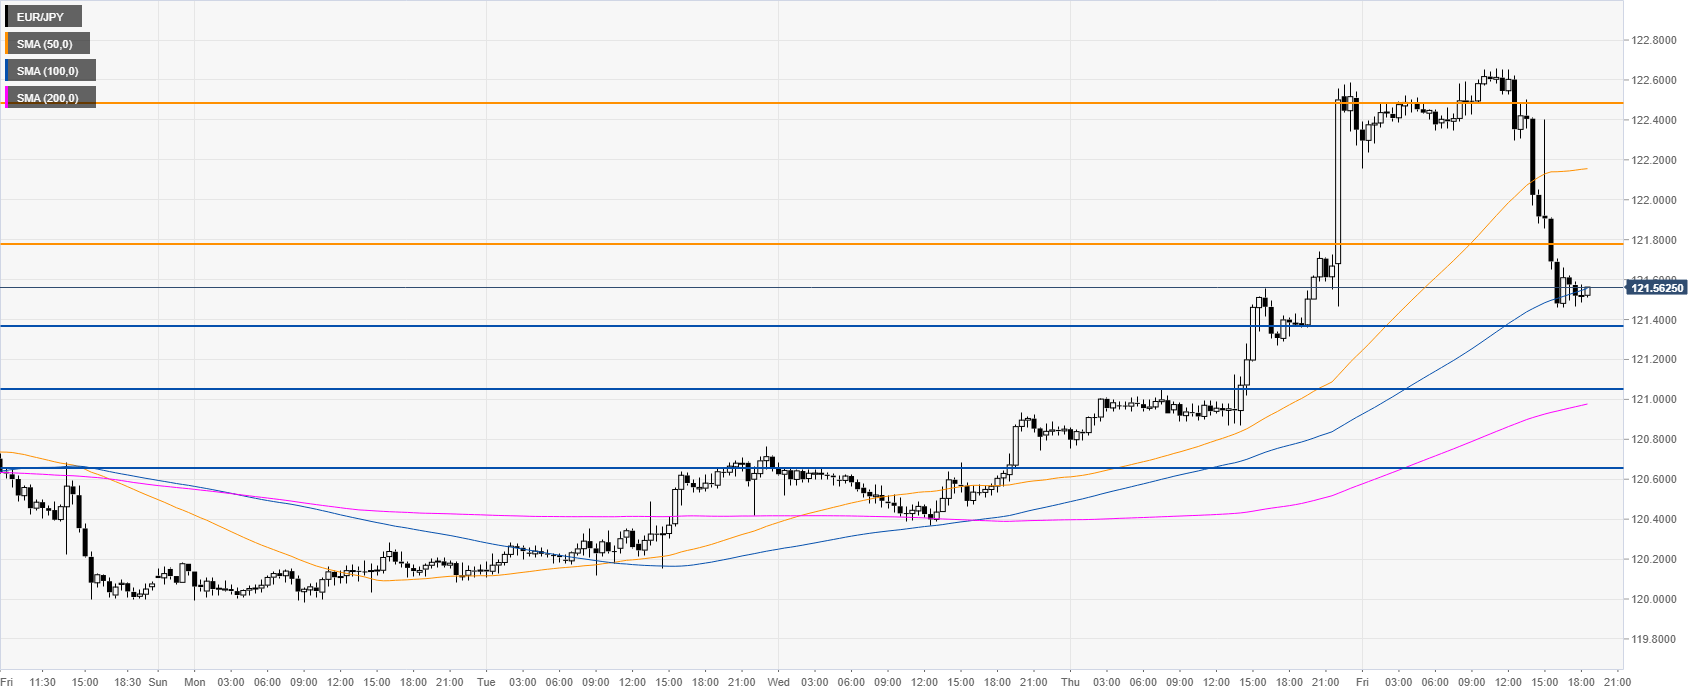
- EUR/JPY is trading near session’s lows after spiking to its highest level since July 2019.
- Resistance is seen at the 121.78 and 122.48 price levels.
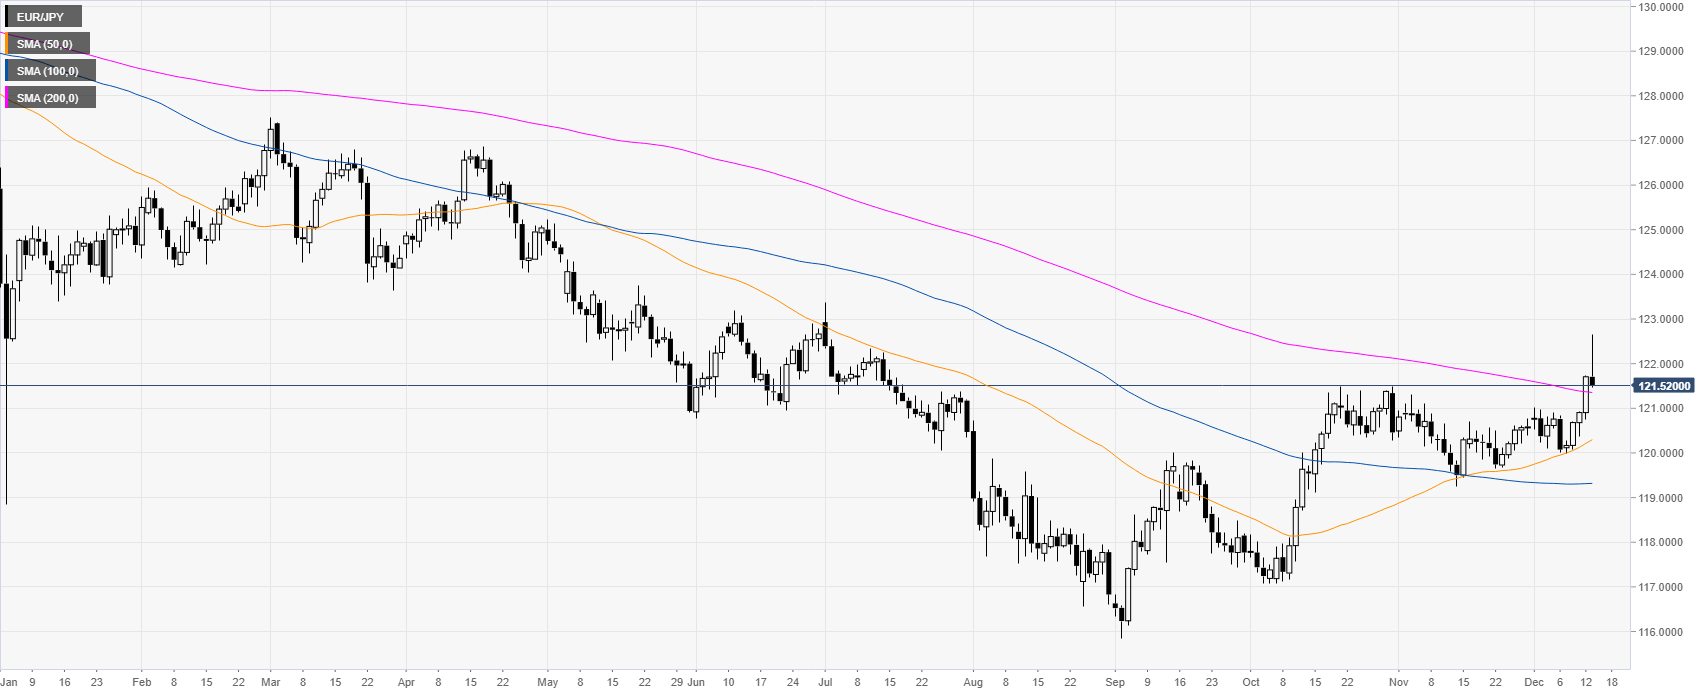
EUR/JPY daily chart
EUR/JPY is about to have a second consecutive close above the 200-day simple moving average (DMA) above the 121.00 handle. However, it seems that Friday will end as a potential bearish reversal day.
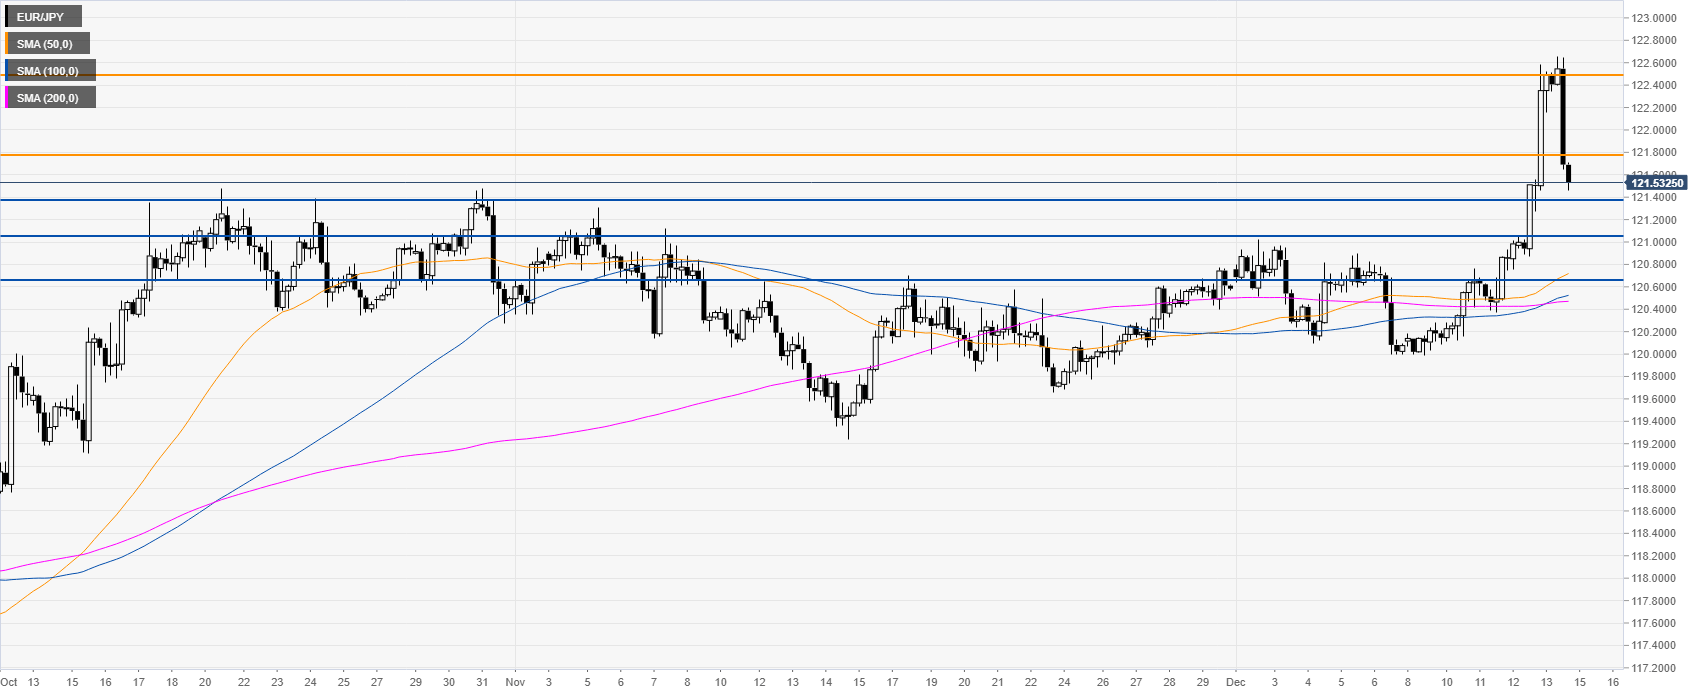
EUR/JPY four-hour chart
The market broke sharply to the 121.78 resistance and dropped almost as fast as it went up. The spot is now nearing the 121.40 support. A break below this level can lead to further weakness towards the 121.08 and 120.65 levels, according to the Technical Confluences Indicator.
EUR/JPY 30-minute chart
EUR/JPY is trading near session’s lows below the 50/100 SMAs. Resistance is seen at the 121.78 and 122.48 price levels.
Additional key levels
