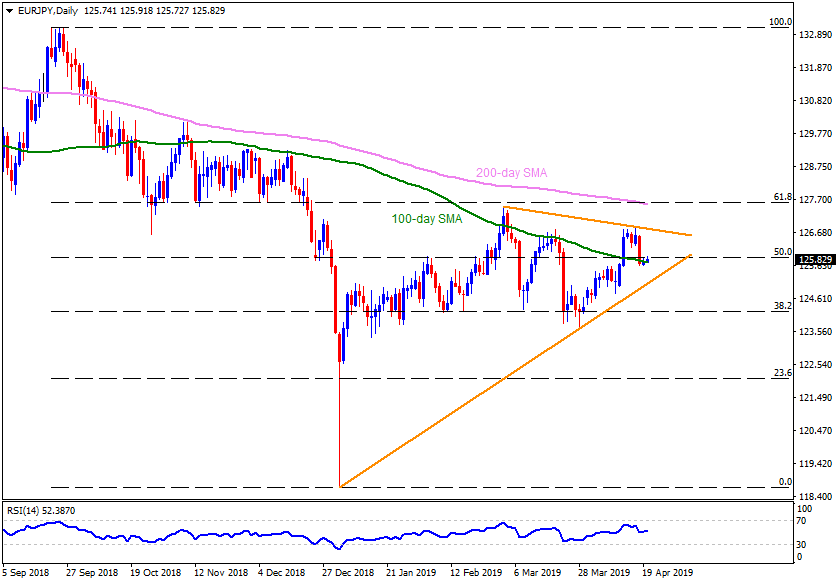
The EUR/JPY pair is on the rounds near 125.80 during early Monday. While failure to provide sustained downturn under 100-day simple moving average (SMA) triggered the quote’s pullback, 50% Fibonacci retracement of October 2018 to January 2019 seems acting as immediate resistance for the pair.
In a case gradually recovery 14-day relative strength index (RSI) fuels the pair beyond 125.90 adjacent upside barrier, 126.20 and a downward sloping trend-line from March 01 at 126.80 can please the buyers.
However, Bulls ability to cross 126.80 on a daily closing basis could escalate the recovery towards 127.50/60 resistance-confluence comprising 200-day SMA and 61.8% Fibonacci retracement level.
Meanwhile, a downside break of 125.70 figure including 100-day SMA highlights the importance of an ascending trend-line that connects January low to March low at 125.00.
If at all the JPY strength drags the pair under 125.00, 124.70 and 38.2% Fibonacci retracement near 124.20 might flash on the chart.
EUR/JPY daily chart
Trend: Sideways
