- The EUR/JPY pair trades near 127.30 during early Monday.
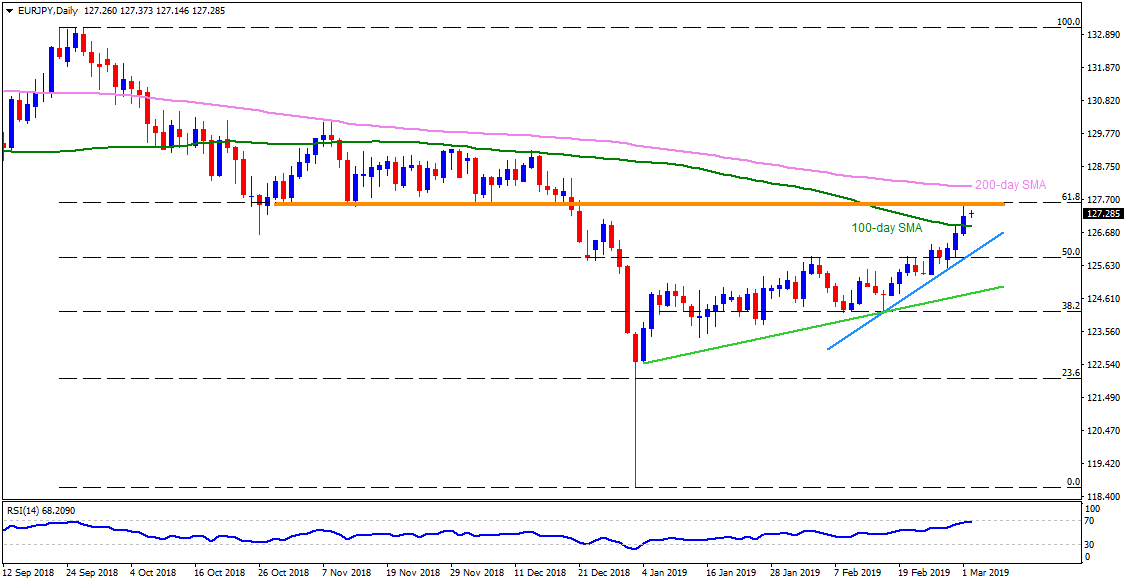
- The pair successfully trades beyond 100-day simple moving average (SMA) for the first time in a year but is yet to clear the 127.50-60 resistance-region, including 61.8% Fibonacci retracement of its September – January south-run.
- Should prices manage to conquer 127.60 upside barrier, 200-day SMA level of 128.15 is likely another stop that can challenge buyers.
- During the pair’s rise after 128.15, 129.30 and 130.00 might become bulls’ favorites.
- Meanwhile, 100-day SMA level of 126.85 can act as immediate support for the pair, a break of which can print 126.40 on the chart.
- However, 50% Fibonacci and an upward sloping support-line joining the lows of February 15 and 27 could limit the quote’s downside at 125.85.
- It should also be noted that bears’ dominance past-125.85 might not hesitate to flash 125.00 as a quote.
EUR/JPY daily chart
Additional important levels:
Overview:
Today Last Price: 127.26
Today Daily change: 1 pips
Today Daily change %: 0.01%
Today Daily Open: 127.25
Trends:
Daily SMA20: 125.45
Daily SMA50: 125.08
Daily SMA100: 126.83
Daily SMA200: 128.12
Levels:
Previous Daily High: 127.52
Previous Daily Low: 126.6
Previous Weekly High: 127.52
Previous Weekly Low: 125.38
Previous Monthly High: 126.92
Previous Monthly Low: 124.16
Daily Fibonacci 38.2%: 127.17
Daily Fibonacci 61.8%: 126.96
Daily Pivot Point S1: 126.73
Daily Pivot Point S2: 126.21
Daily Pivot Point S3: 125.81
Daily Pivot Point R1: 127.65
Daily Pivot Point R2: 128.04
Daily Pivot Point R3: 128.56
