- The EUR/JPY has seen steady lift in July, closing on the green for nine consecutive trading days.
- The current intraday action is hesitating near recent peaks, and continued softness will see a bearish correction begin to form up.
- The pair’s pattern of consecutive lower highs on Daily candles has broken after July saw a break of June’s peaks near 130.35.
EUR/JPY Chart, 15-Minute
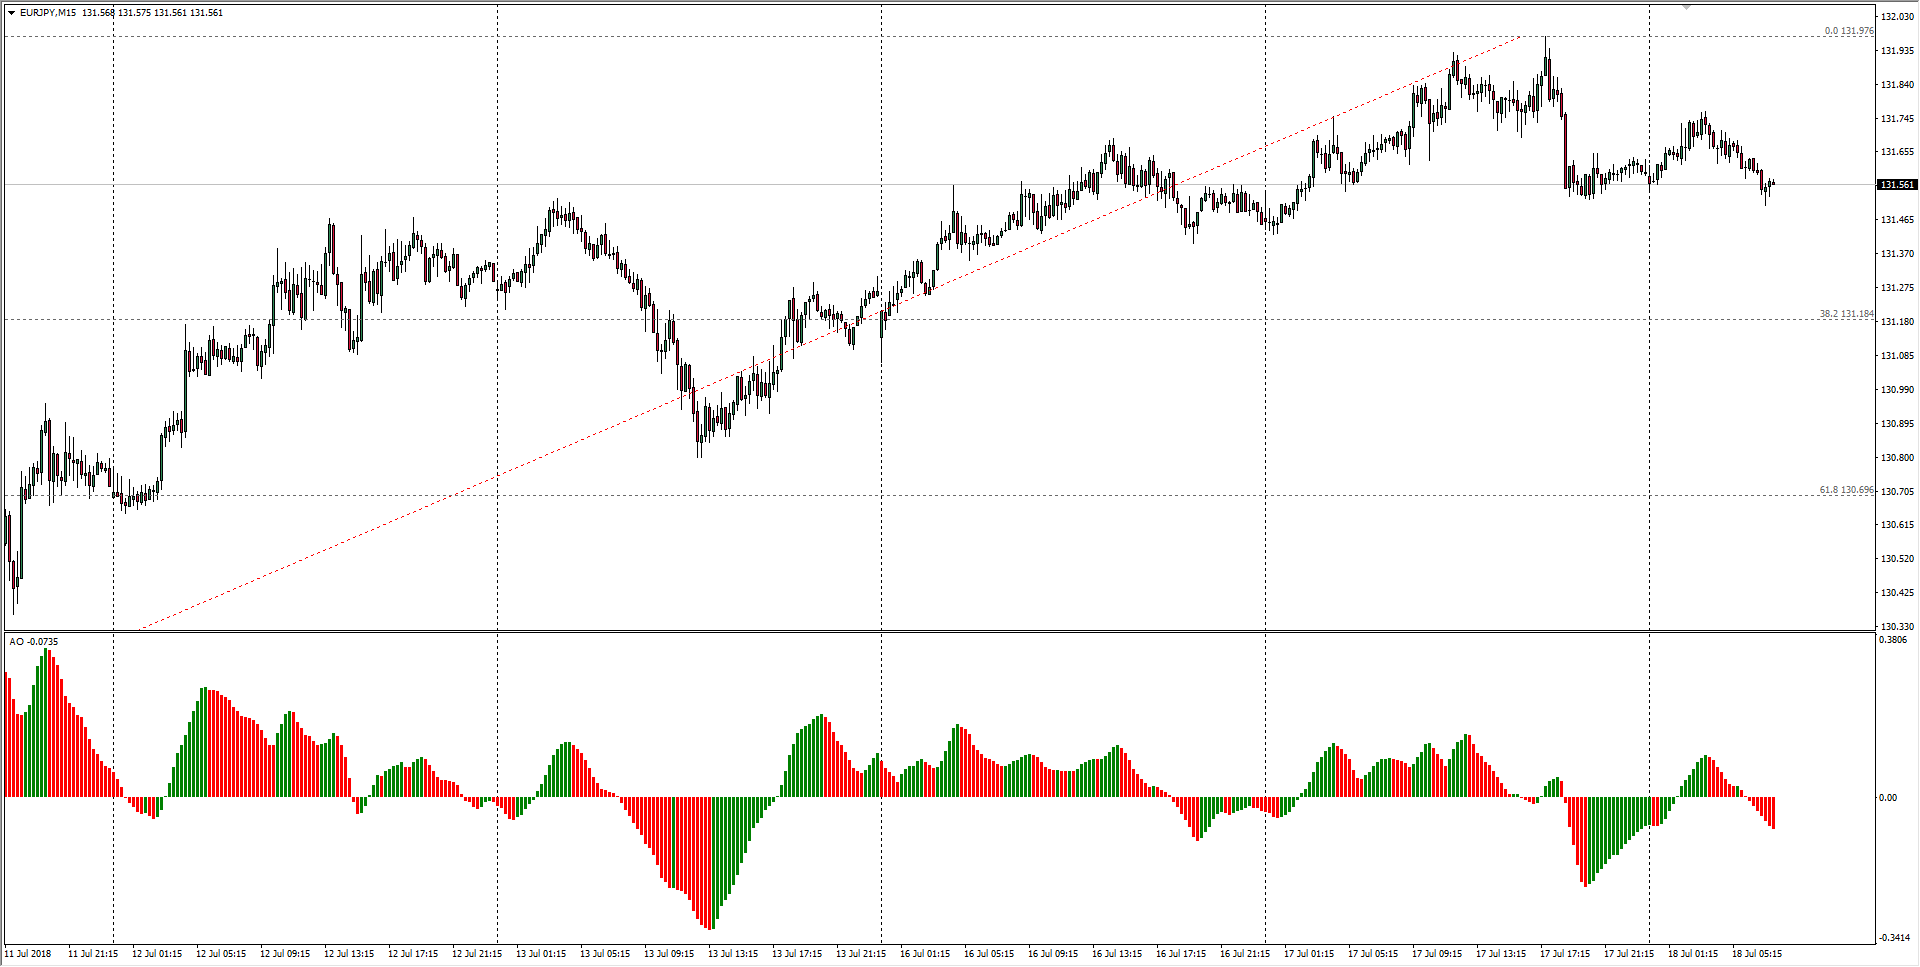
| Spot rate: | 131.56 |
| Relative change: | -0.01% |
| High: | 131.76 |
| Low: | 131.50 |
| Trend: | Flat to bullish |
| Support 1: | 131.06 (current week low) |
| Support 2: | 130.69 (61.8% Fibo retracement level) |
| Support 3: | 129.90 (July 11th swing low) |
| Resistance 1: | 131.76 (current day high) |
| Resistance 2: | 131.97 (current week high) |
| Resistance 3: | 132.42 (March 13th swing high) |
