“¢ Retreats from an ascending trend-line resistance, forming a part of a bearish rising wedge chart pattern on the 1-hourly chart.
“¢ Bullish moving averages cross-over suggests dip buying to emerge at lower levels.
“¢ Break below an ascending trend-line, the bearish pattern, might continue to find support near mid-127.00s.
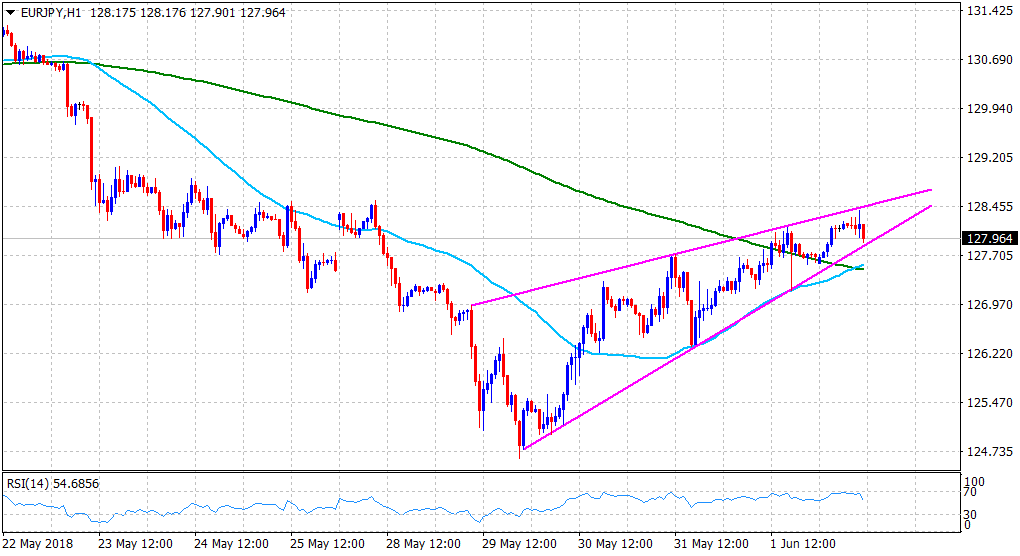
Spot Rate: 127.96
Daily High: 128.40
Daily Low: 127.58
Trend: Bullish
Resistance
R1: 128.40 (session top)
R2: 128.21 (R1 daily pivot-point)
R3: 128.54 (May 28th high)
Support
S1: 127.84 (ascending trend-line support)
S2: 127.58 (daily low and 50-hour SMA H1)
S3: 127.18 (S1 daily pivot-point)
