- EUR/JPY is correcting the October bull run.
- The level to beat for sellers is the 120.15 level.
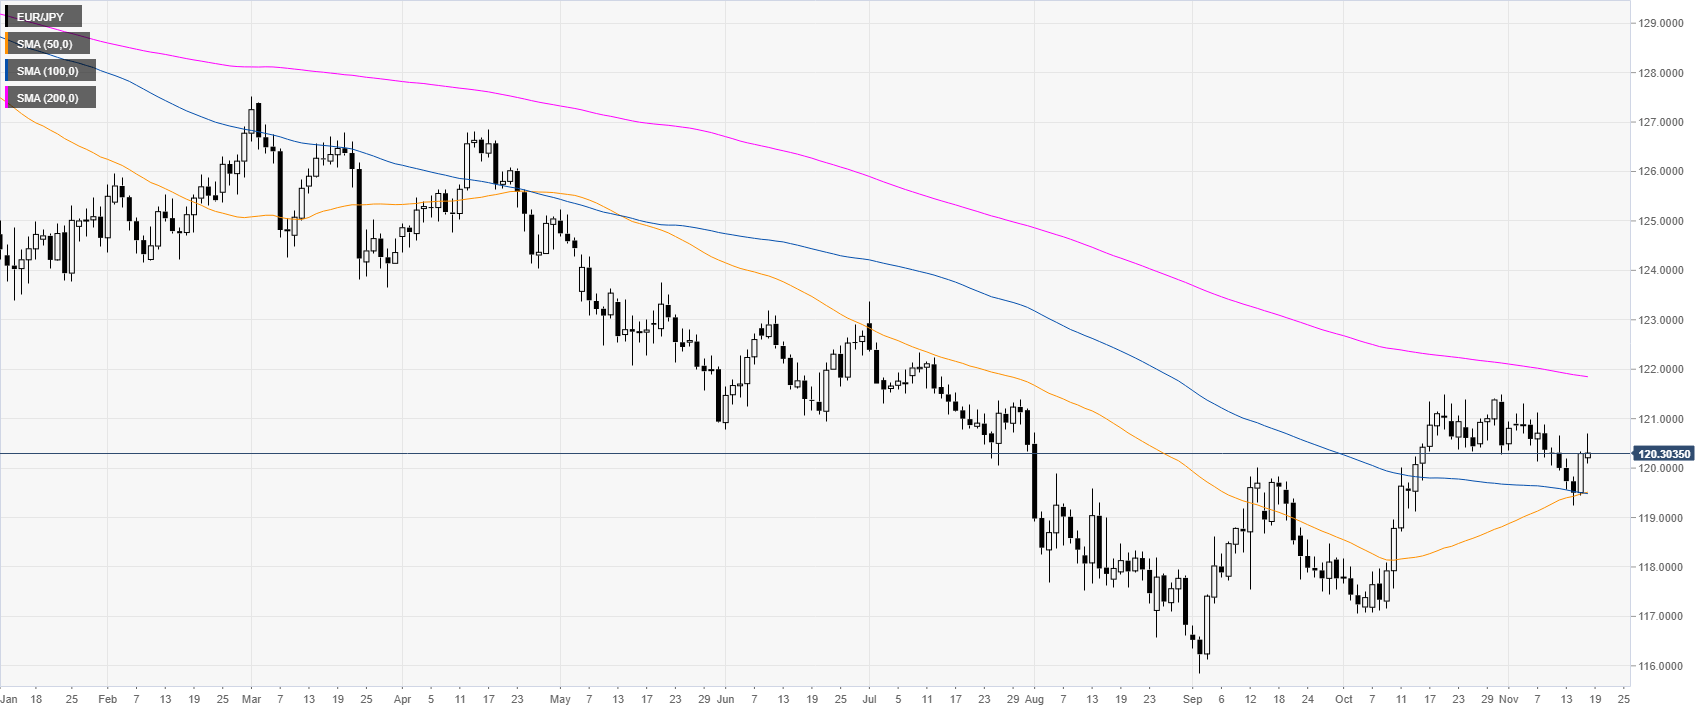
EUR/JPY daily chart
EUR/JPY is trading in a downtrend below the 200-day simple moving average (DMA). The market is currently correcting down after the October bull run as the price remains capped below the 121.00 handle.
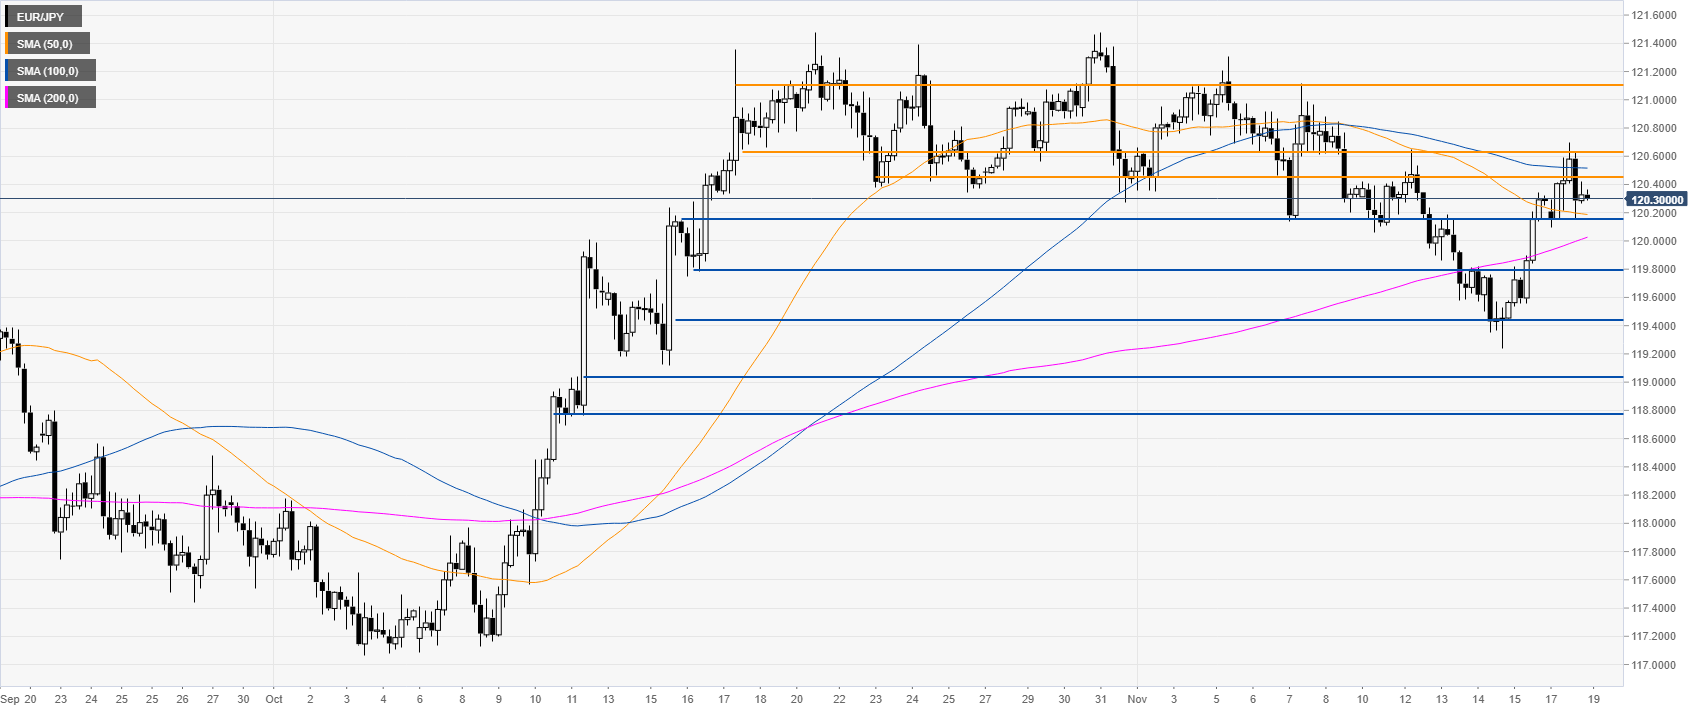
EUR/JPY four-hour chart
On the four-hour chart, the market challenged the 120.64 resistance and the 100 SMA. If on Tuesday, the market is able to overcome the 120.64 level then a run towards the 121.11 resistance can be on the cards.
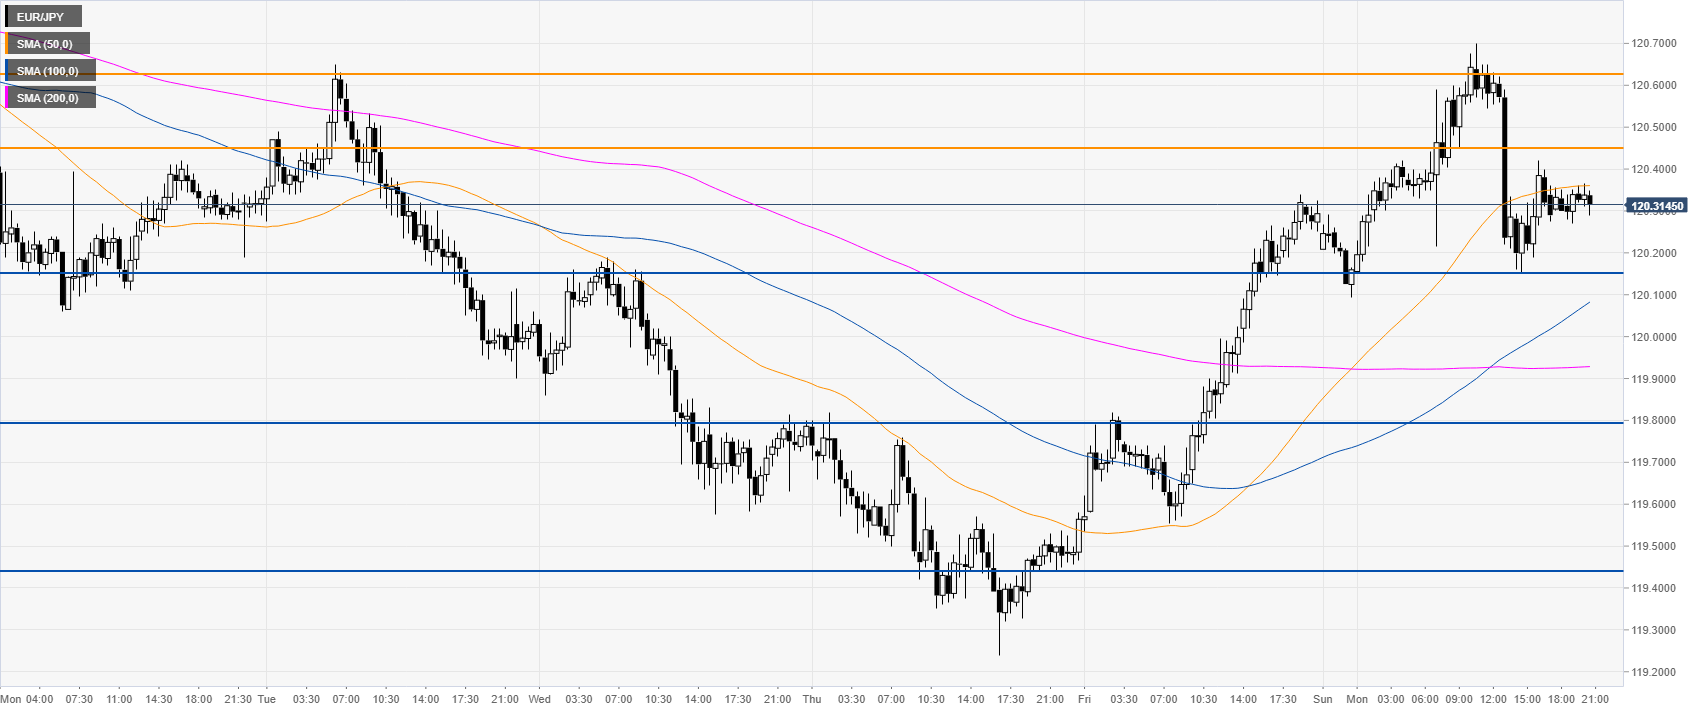
EUR/JPY 30-minute chart
The spot reversed almost the entirety of the daily gains while the market trades below the 50 SMA. A break below 120.15 can lead to 119.80 on the way down, according to Technical Confluences Indicator.
Additional key levels
