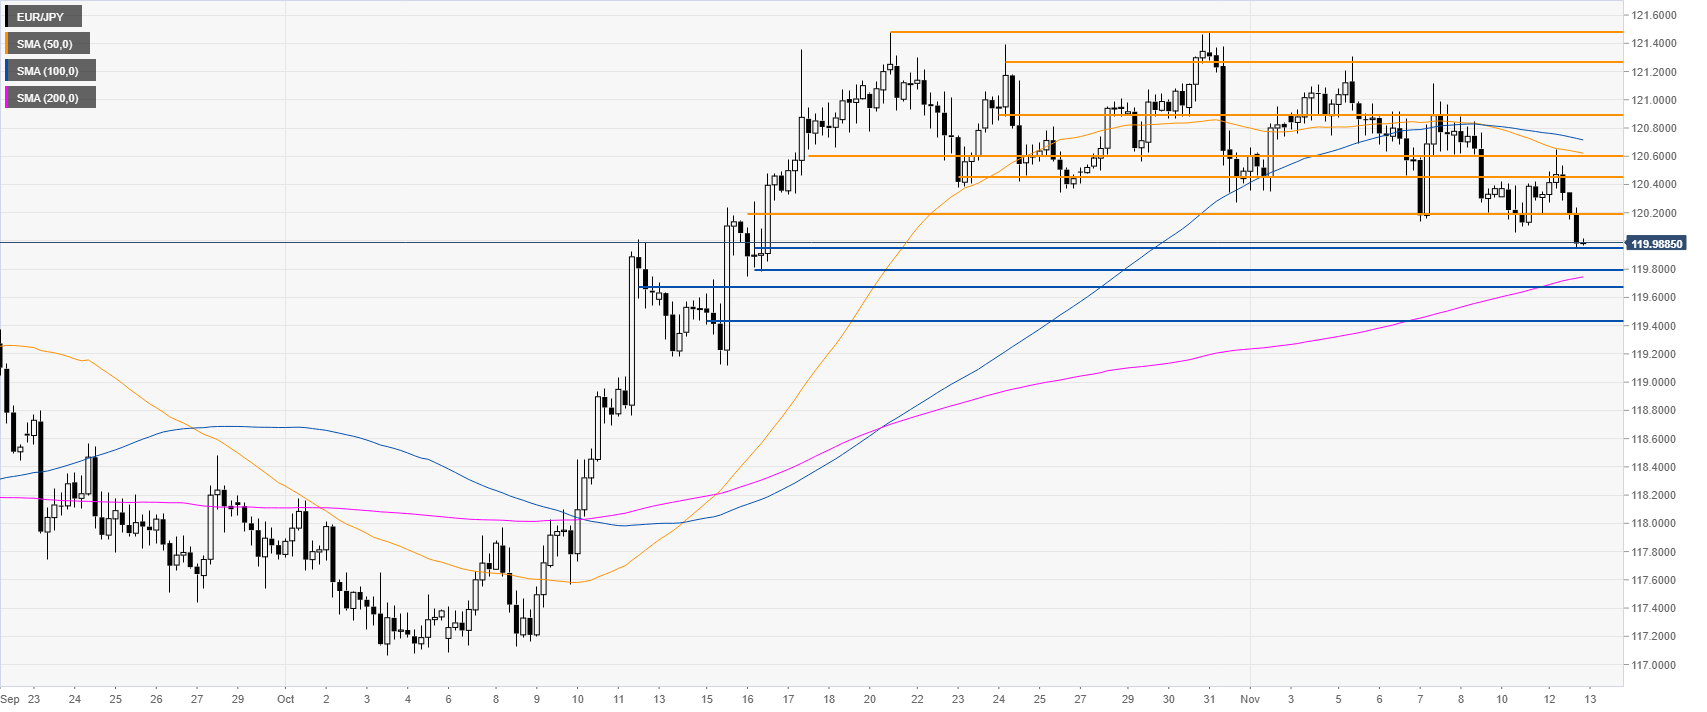
- EUR/JPY is drifting lower, correcting the October bull rally.
- The level to beat for bears is the 119.94/81 support zone.
EUR/JPY daily chart
EUR/JPY is trading in a downtrend below the 200-day simple moving average (DMA). However, last month the cross had a rally to the 121.00 figure. The spot has been entering a consolidation in mid-October and November.

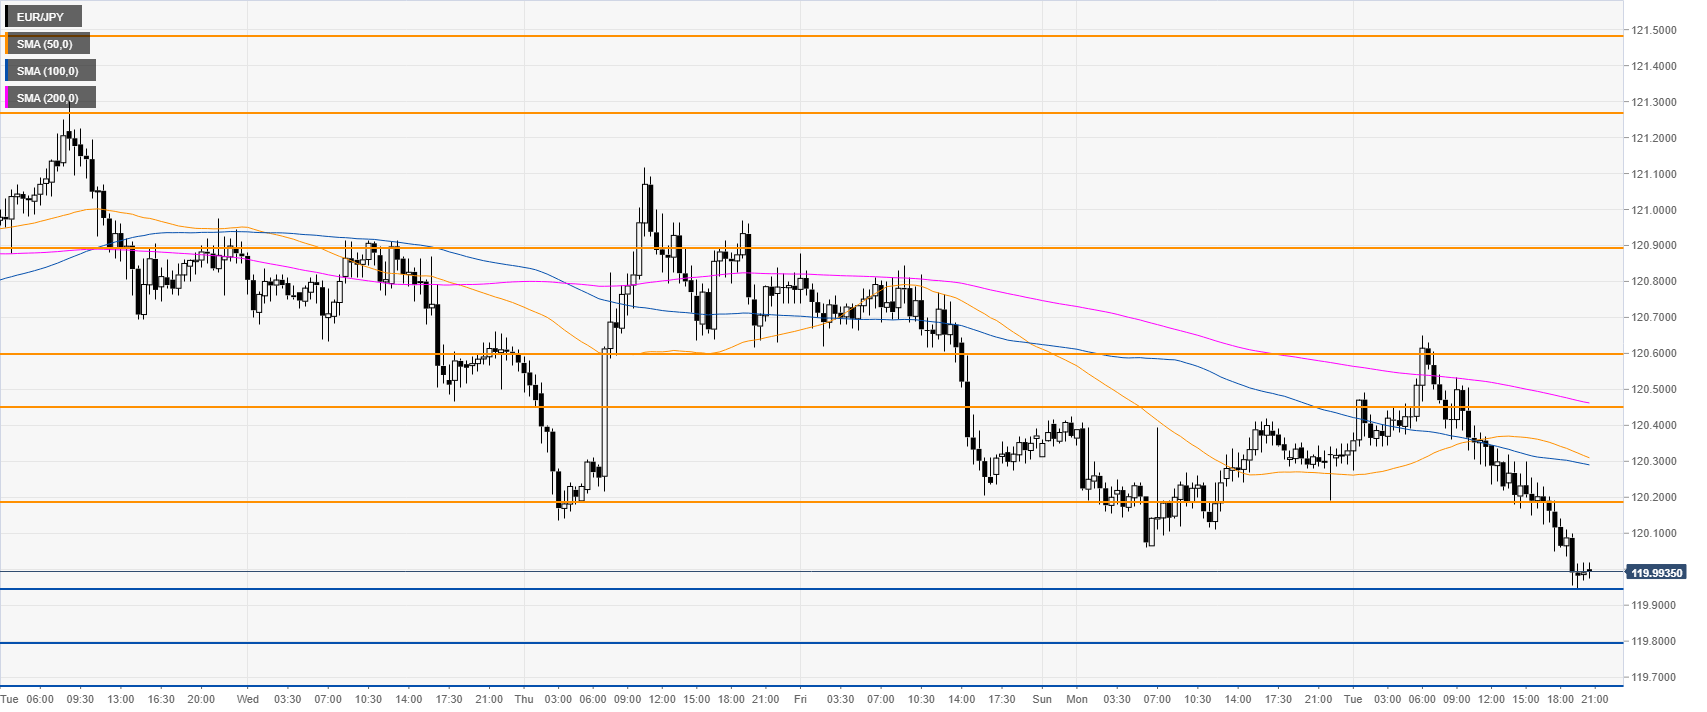
EUR/JPY four-hour chart
On the four-hour chart, the market is drifting down below its 50 and 100 SMAs. A break below 119.94/81 support zone can drive the cross towards the 119.66 and 119.44 in the medium term.
EUR/JPY 30-minute chart
The market is trading below its main SMAs, suggesting a bearish bias in the near term. Resistances are seen at the 119.20, 120.44 and 120.66 levels, according to the Technical Confluences Indicator.
Additional key levels
