- The prevailing selling mood continues to hurt the Japanese Yen and is therefore propelling the recovery in EUR/JPY from last week’s lows in the 126.65/60 band.
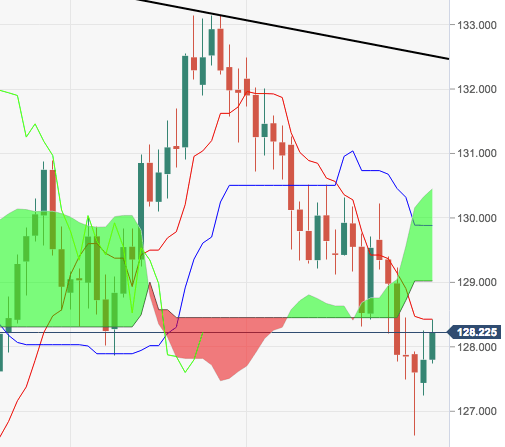
- The ongoing recovery should meet initial hurdle at the 10-day SMA at 128.54 and could extend to the 129.00 neighbourhood and above, where is located the 21-day SMA and 100-day SMA, at 129.46 and 129.47, respectively.
- In case the cross resumes the down trend, last week’s low at 126.61 could pave the way for a potential visit to August’s low at 124.90, regarded as the last defense of a probable test of YTD low at 124.61 seen in late-May.
EUR/JPY daily chart
EUR/JPY
Overview:
Last Price: 128.19
Daily change: 39 pips
Daily change: 0.305%
Daily Open: 127.8
Trends:
Daily SMA20: 129.51
Daily SMA50: 129.95
Daily SMA100: 129.47
Daily SMA200: 130.52
Levels:
Daily High: 128.26
Daily Low: 127.24
Weekly High: 130.22
Weekly Low: 126.63
Monthly High: 133.15
Monthly Low: 127.87
Daily Fibonacci 38.2%: 127.87
Daily Fibonacci 61.8%: 127.63
Daily Pivot Point S1: 127.28
Daily Pivot Point S2: 126.76
Daily Pivot Point S3: 126.27
Daily Pivot Point R1: 128.29
Daily Pivot Point R2: 128.78
Daily Pivot Point R3: 129.3
