- The cross met strong resistance in levels just beyond 132.00 the figure, where sits the key 200-day SMA.
- Bullish momentum, however, remains unchanged while above mid-June peaks in the 130.40 band. This view should be reinforced as long as the cross trades above the daily cloud.
- Further upside is expected to target the 133.50 region, levels last traded in mid-April.
- Additionally, the cross has retreated from the boundaries of the overbought territory, motivating the daily RSI to recede to the 59 area.
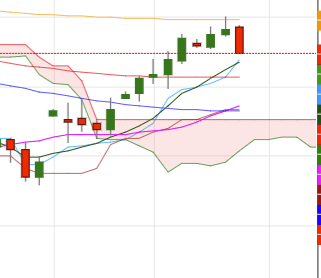
EUR/JPY daily chart
Daily high: 131.79
Daily low: 130.88
Support Levels
S1: 131.37
S2: 131.12
S3: 130.80
Resistance Levels
R1: 131.94
R2: 132.26
R3: 132.51
