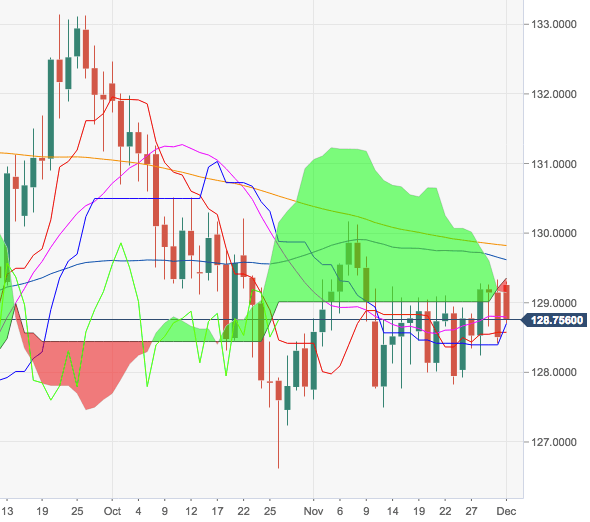
- The cross is down for yet another session on Monday, returning to the 128.70 region after another failed attempt to consolidate a breakout of 129.00 the figure.
- Selling pressure is expected to persist for the time being as long as the low-129.00s barrier continues to cap the upside in the near term.
- That said, there is still scope for another visit to November’s low in the 127.50 zone.
EUR/JPY daily chart
EUR/JPY
Overview:
Today Last Price: 128.76
Today Daily change: 25 pips
Today Daily change %: 0.195%
Today Daily Open: 128.51
Trends:
Previous Daily SMA20: 128.8
Previous Daily SMA50: 129.47
Previous Daily SMA100: 129.4
Previous Daily SMA200: 129.85
Levels:
Previous Daily High: 129.33
Previous Daily Low: 128.42
Previous Weekly High: 129.33
Previous Weekly Low: 127.92
Previous Monthly High: 130.16
Previous Monthly Low: 127.5
Previous Daily Fibonacci 38.2%: 128.76
Previous Daily Fibonacci 61.8%: 128.98
Previous Daily Pivot Point S1: 128.17
Previous Daily Pivot Point S2: 127.84
Previous Daily Pivot Point S3: 127.26
Previous Daily Pivot Point R1: 129.09
Previous Daily Pivot Point R2: 129.67
Previous Daily Pivot Point R3: 130
