- The cross is down for the second straight session on Thursday amidst increasing selling pressure around the European currency.
- The continuation of the leg lower should initially meet weekly lows in the mid-127.00s ahead of the more relevant contention area around 126.60, October’s low.
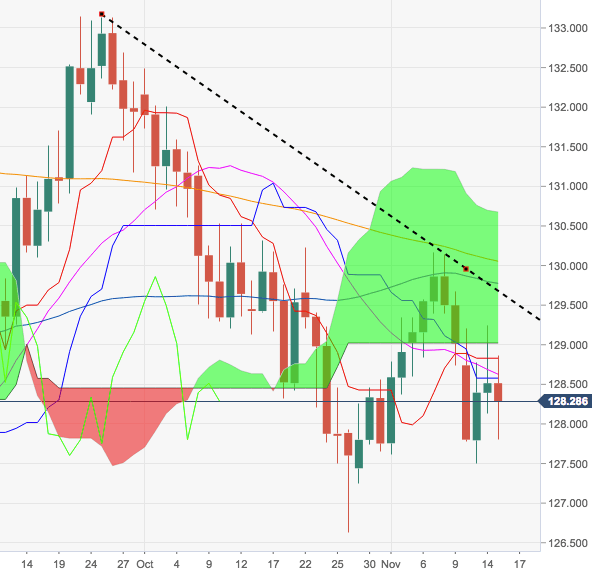
- In the meantime, the up move remains capped by yesterday’s top in the 129.20/25 band, while a tougher barrier lies in the 129.54/130.04 band, where coincide the 100-, 55- and 200-day SMAs.
- Looking at the broader picture, the stance on EUR/JPY should remain negative as long as the resistance line at 129.67 caps.
EUR/JPY daily chart
EUR/JPY
Overview:
Last Price: 128.24
Daily change: -27 pips
Daily change: -0.210%
Daily Open: 128.51
Trends:
Daily SMA20: 128.64
Daily SMA50: 129.85
Daily SMA100: 129.53
Daily SMA200: 130.11
Levels:
Daily High: 129.24
Daily Low: 128.13
Weekly High: 130.16
Weekly Low: 128.6
Monthly High: 132.49
Monthly Low: 126.63
Daily Fibonacci 38.2%: 128.82
Daily Fibonacci 61.8%: 128.56
Daily Pivot Point S1: 128.01
Daily Pivot Point S2: 127.52
Daily Pivot Point S3: 126.9
Daily Pivot Point R1: 129.13
Daily Pivot Point R2: 129.74
Daily Pivot Point R3: 130.24
