- After two consecutive daily advances, EUR/JPY is now struggling to add to recent gains amidst some renewed selling pressure hitting the European currency.
- The resumption of the downtrend could well see October’s low in the 1.2660 region retested ahead of August’s low at 124.91.
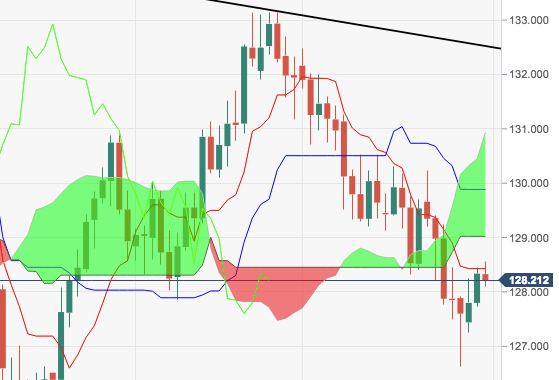
- On the upside, a clear break above the 10-day SMA at 128.42 should open the door for a visit to the 129.00 neighbourhood (where sits the base of the daily cloud) and above, where emerge the 21-, 100- and 55-day SMA.
EUR/JPY daily chart
EUR/JPY
Overview:
Last Price: 128.26
Daily change: -8.0 pips
Daily change: -0.0623%
Daily Open: 128.34
Trends:
Daily SMA20: 129.37
Daily SMA50: 129.97
Daily SMA100: 129.46
Daily SMA200: 130.49
Levels:
Daily High: 128.46
Daily Low: 127.74
Weekly High: 130.22
Weekly Low: 126.63
Monthly High: 133.15
Monthly Low: 127.87
Daily Fibonacci 38.2%: 128.18
Daily Fibonacci 61.8%: 128.01
Daily Pivot Point S1: 127.9
Daily Pivot Point S2: 127.46
Daily Pivot Point S3: 127.18
Daily Pivot Point R1: 128.62
Daily Pivot Point R2: 128.9
Daily Pivot Point R3: 129.34
