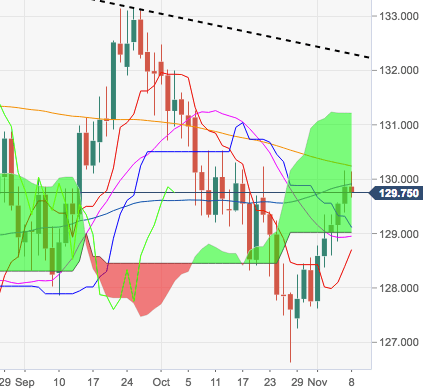
- The recovery in the cross met strong resistance in the boundaries of the key 200-day SMA at 130.2, provoking failure and the ongoing knee-jerk after five consecutive daily advances.
- Immediate target on the upside remains the 200-day SMA at 130.21. A sustainable breakout of this area should pave the way for a visit to late-August peaks around 130.90.
- In order to reassert the upside pressure, EUR/JPY needs to break above the resistance line off YTD tops, today at 132.29.
EUR/JPY daily chart
EUR/JPY
Overview:
Last Price: 129.74
Daily change: -12 pips
Daily change: -0.0924%
Daily Open: 129.86
Trends:
Daily SMA20: 128.91
Daily SMA50: 129.91
Daily SMA100: 129.49
Daily SMA200: 130.29
Levels:
Daily High: 130.16
Daily Low: 129.39
Weekly High: 129.34
Weekly Low: 127.24
Monthly High: 132.49
Monthly Low: 126.63
Daily Fibonacci 38.2%: 129.87
Daily Fibonacci 61.8%: 129.69
Daily Pivot Point S1: 129.45
Daily Pivot Point S2: 129.03
Daily Pivot Point S3: 128.67
Daily Pivot Point R1: 130.22
Daily Pivot Point R2: 130.58
Daily Pivot Point R3: 130.99
