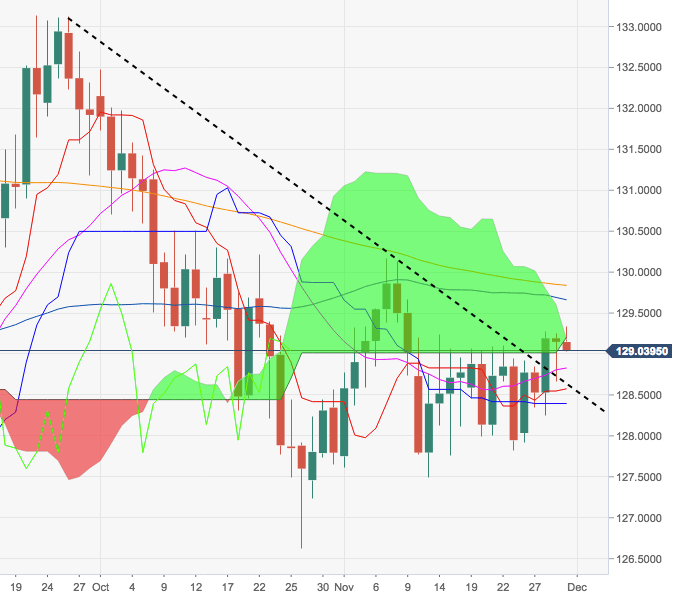
- EUR/JPY has broken above the key short-term resistance line at 128.63 and is flirting with the base of the daily cloud.
- Downside pressure now appears somewhat alleviated and could allow for a visit to the key 200-day SMA, today at 129.84, ahead of November’s peaks beyond 130.00 the figure.
- Looking south, interim support emerges at the 10-day SMA at 128.74 ahead of monthly lows in the mid-127.00s.
EUR/JPY daily chart
EUR/JPY
Overview:
Today Last Price: 129.06
Today Daily change: -9.0 pips
Today Daily change %: -0.0697%
Today Daily Open: 129.15
Trends:
Previous Daily SMA20: 128.82
Previous Daily SMA50: 129.54
Previous Daily SMA100: 129.43
Previous Daily SMA200: 129.86
Levels:
Previous Daily High: 129.26
Previous Daily Low: 128.66
Previous Weekly High: 129.12
Previous Weekly Low: 127.82
Previous Monthly High: 132.49
Previous Monthly Low: 126.63
Previous Daily Fibonacci 38.2%: 128.89
Previous Daily Fibonacci 61.8%: 129.03
Previous Daily Pivot Point S1: 128.79
Previous Daily Pivot Point S2: 128.43
Previous Daily Pivot Point S3: 128.2
Previous Daily Pivot Point R1: 129.38
Previous Daily Pivot Point R2: 129.61
Previous Daily Pivot Point R3: 129.97
